
Dynamic Light Scattering (DLS)
Hydrodynamic diameter and polydispersity index (PDI) of nanoparticles in suspension.
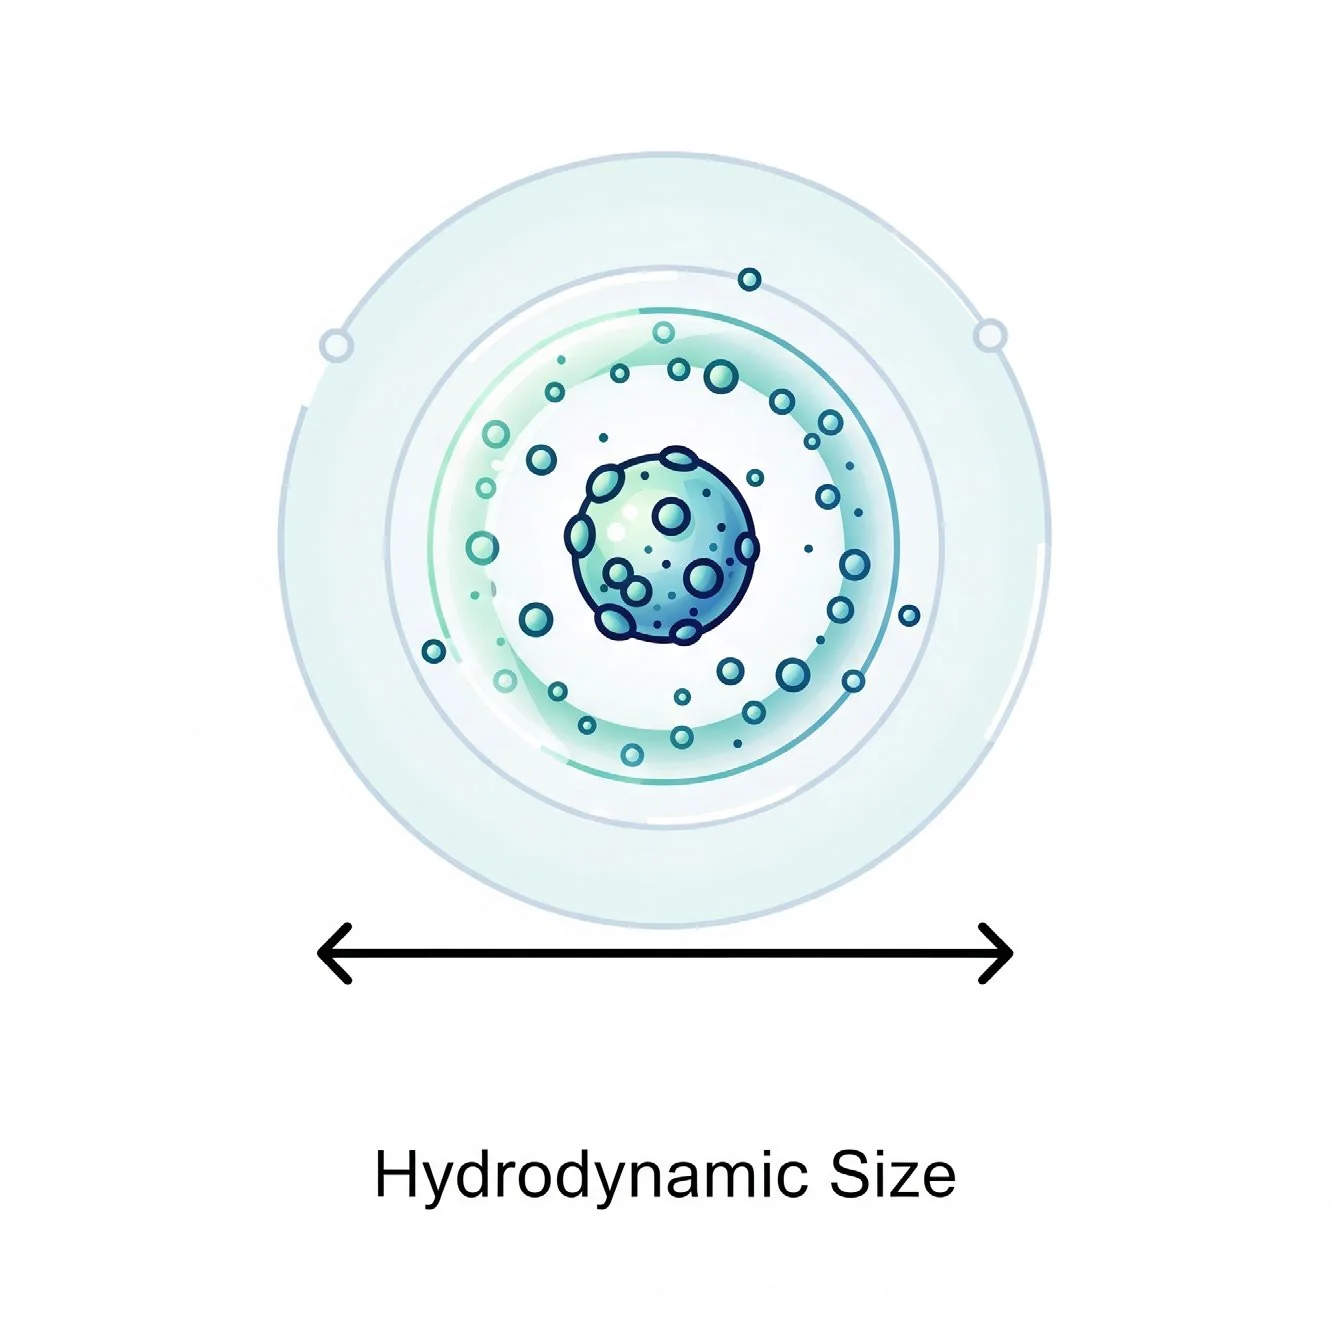
To determine the hydrodynamic diameter (size) and polydispersity index (PDI) of nanoparticles in suspension. This helps assess the uniformity and stability of transfection complexes (e.g., lipoplexes or polyplexes).
DLS measures the fluctuations in scattered laser light caused by Brownian motion of particles in solution. Smaller particles move faster, leading to faster intensity fluctuations. The diffusion coefficient is calculated and converted to particle size using the Stokes-Einstein equation.
Standard protocol
- 1
Sample preparation
- Dilute the transfection complex (e.g., lipid–nucleic acid formulation) in filtered buffer to an appropriate concentration (typically 0.01–0.1 mg/mL polymer/lipid).
- Avoid aggregation: ensure the sample is well mixed but not vortexed vigorously.
- Filter if necessary (0.45 or 0.22 μm syringe filter), but only if particles are >100 nm; otherwise skip to avoid loss.
- 2
Equilibration
- Allow samples to equilibrate to measurement temperature (usually 25 °C) for 2–5 minutes in the instrument.
- 3
Measurement settings
- Temperature: 25 °C (or a relevant physiological temperature, e.g., 37 °C).
- Refractive index: use the appropriate value (e.g., 1.33 for aqueous buffer).
- Viscosity: default for water unless using special media.
- Run each sample in triplicate.
- 4
Run measurement
- Transfer ~700–1000 μL of sample into the cuvette.
- Insert into the instrument and start the measurement.
- Record the Z-average diameter (nm) and the polydispersity index (PDI); values <0.2 indicate monodisperse samples.
Data interpretation
- Ideal size for transfection: 50–200 nm (for cellular uptake).
- PDI < 0.2: homogeneous population.
- PDI > 0.3: broad size distribution (may affect reproducibility).
Representative data
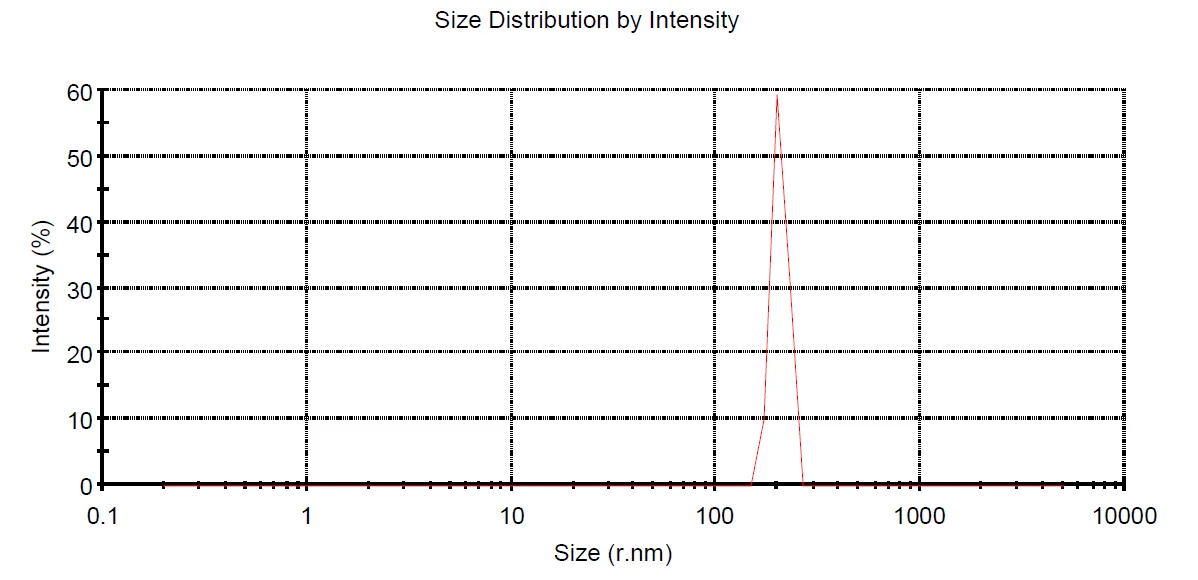
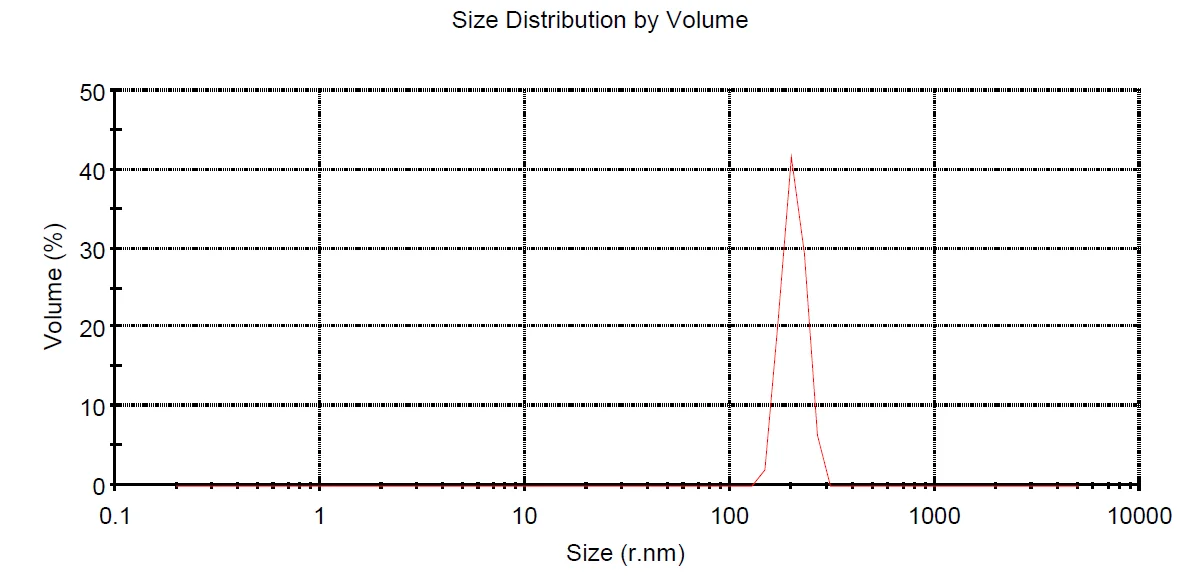
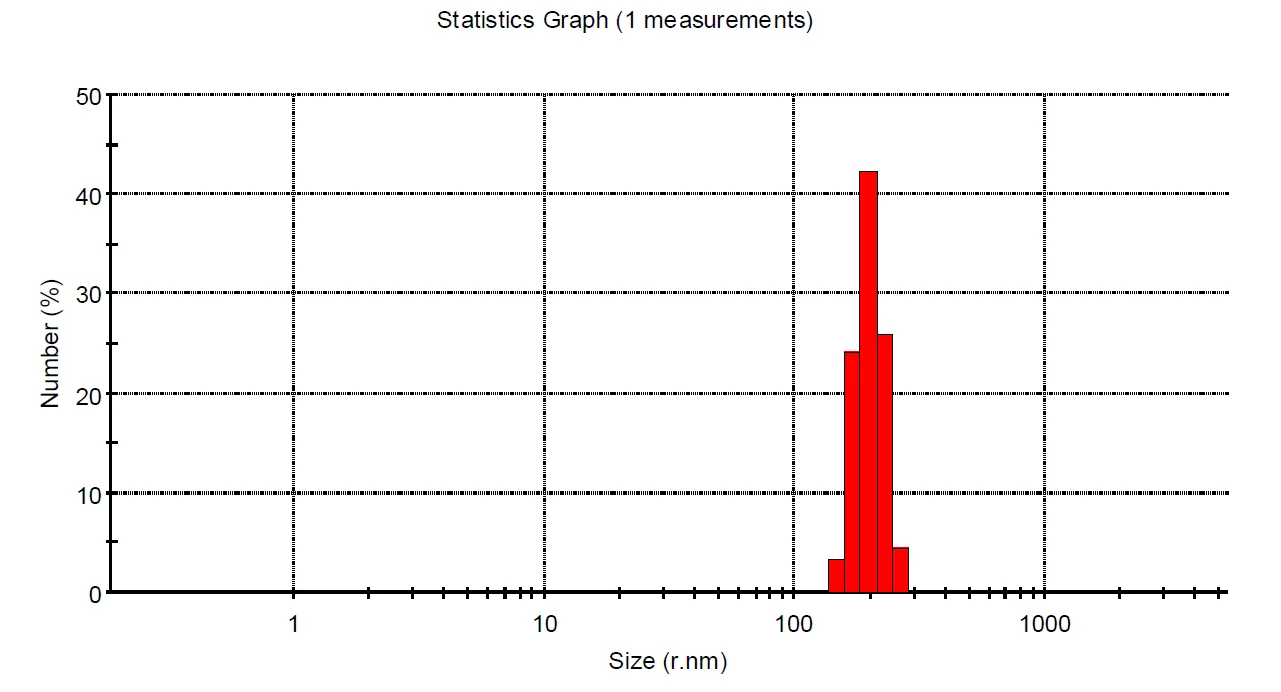
Let's engineer the next delivery breakthrough together
We co-develop nanocarrier and biosensing programs with pharma, biotech and academic groups — from target selection through GMP supply.