
Characterizing nanocarriers, from particle to cell
25 validated tests we use to evaluate gene delivery systems — each with its purpose, principle, materials, a step-by-step protocol and representative data.
Physicochemical Characterization
Size, dispersity, surface charge and particle concentration of nanocarriers in suspension.
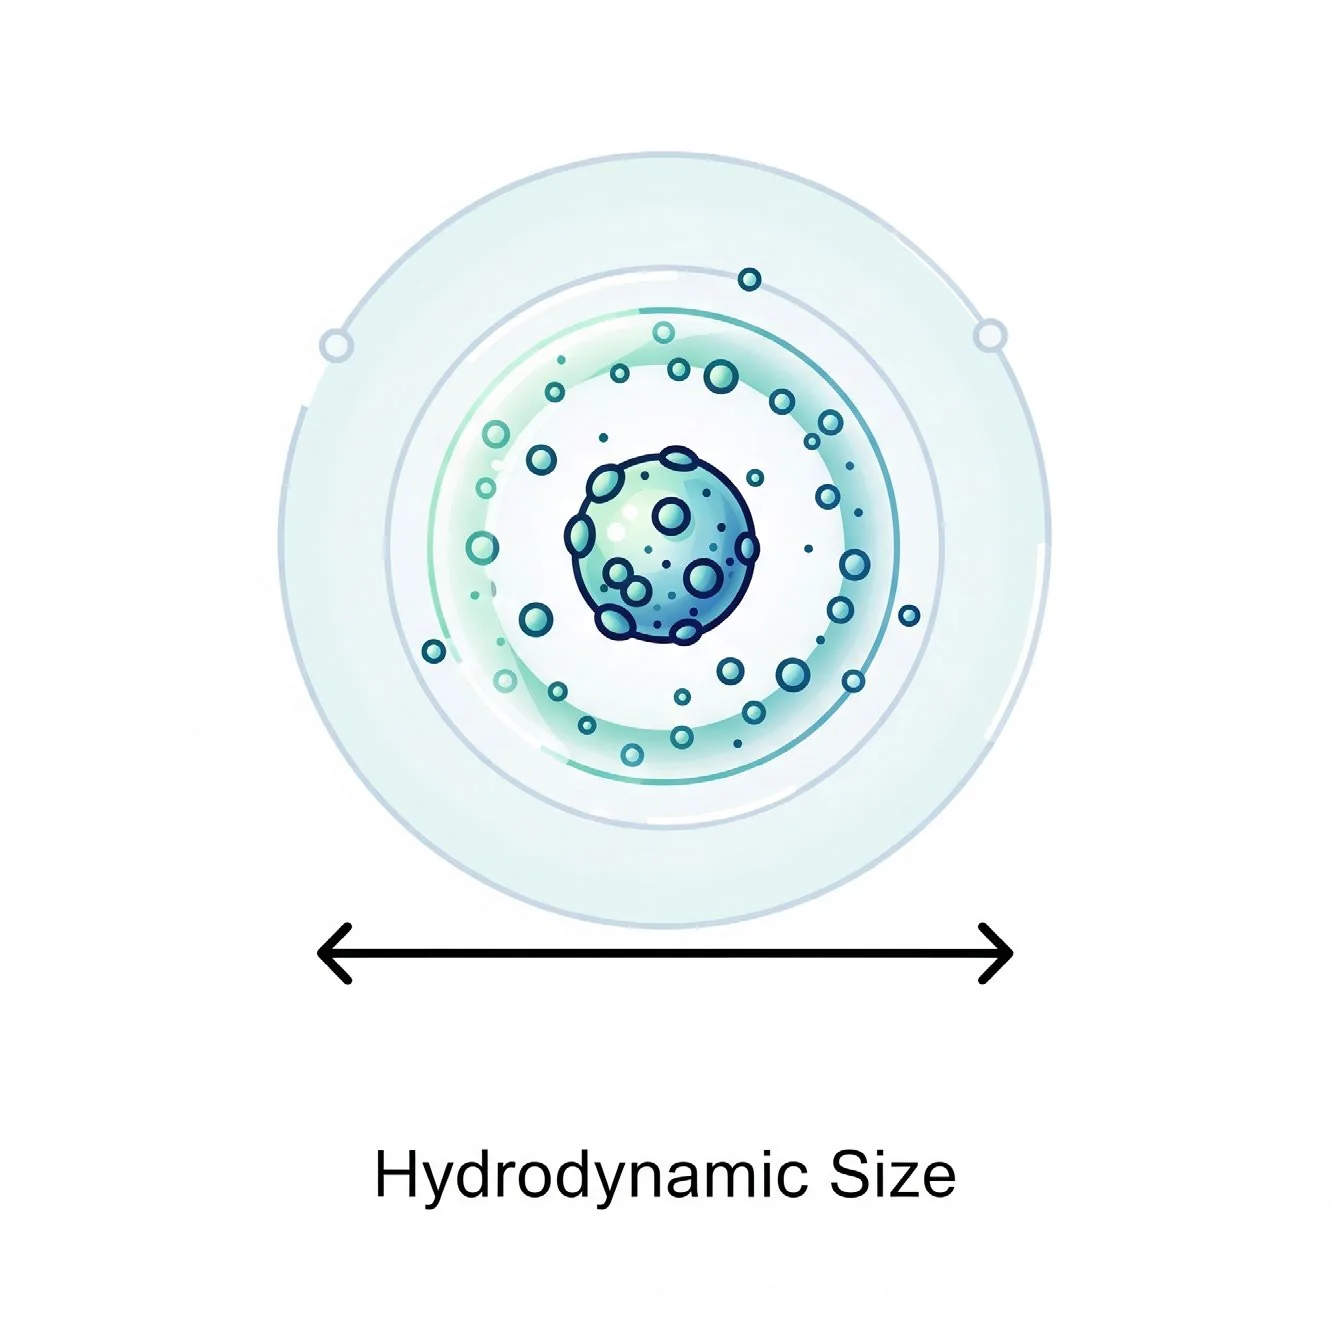
Dynamic Light Scattering (DLS)
Hydrodynamic diameter and polydispersity index (PDI) of nanoparticles in suspension.
Protocol & data
Zeta Potential Measurement
Surface charge of nanoparticles — a driver of colloidal stability and cell interaction.
Protocol & dataNanoparticle Tracking Analysis (NTA)
Particle-by-particle size distribution and concentration in liquid suspension.
Protocol & dataMicroscopy & Microanalysis
Direct imaging of morphology, internal structure, topography and elemental composition.
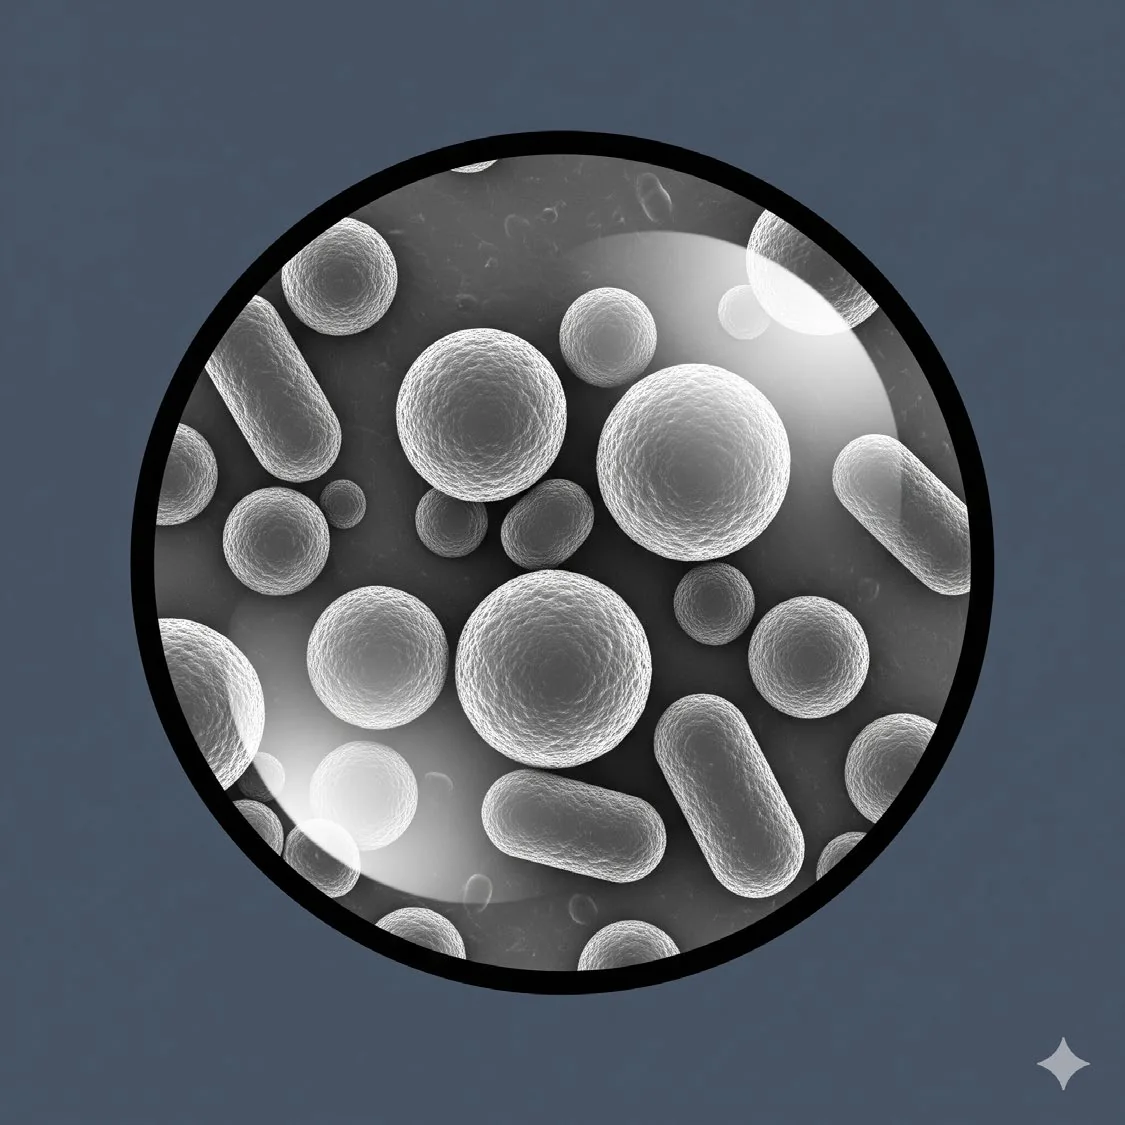
Scanning Electron Microscopy (SEM)
Surface morphology, size, shape and aggregation state of dried nanocarriers.
Protocol & data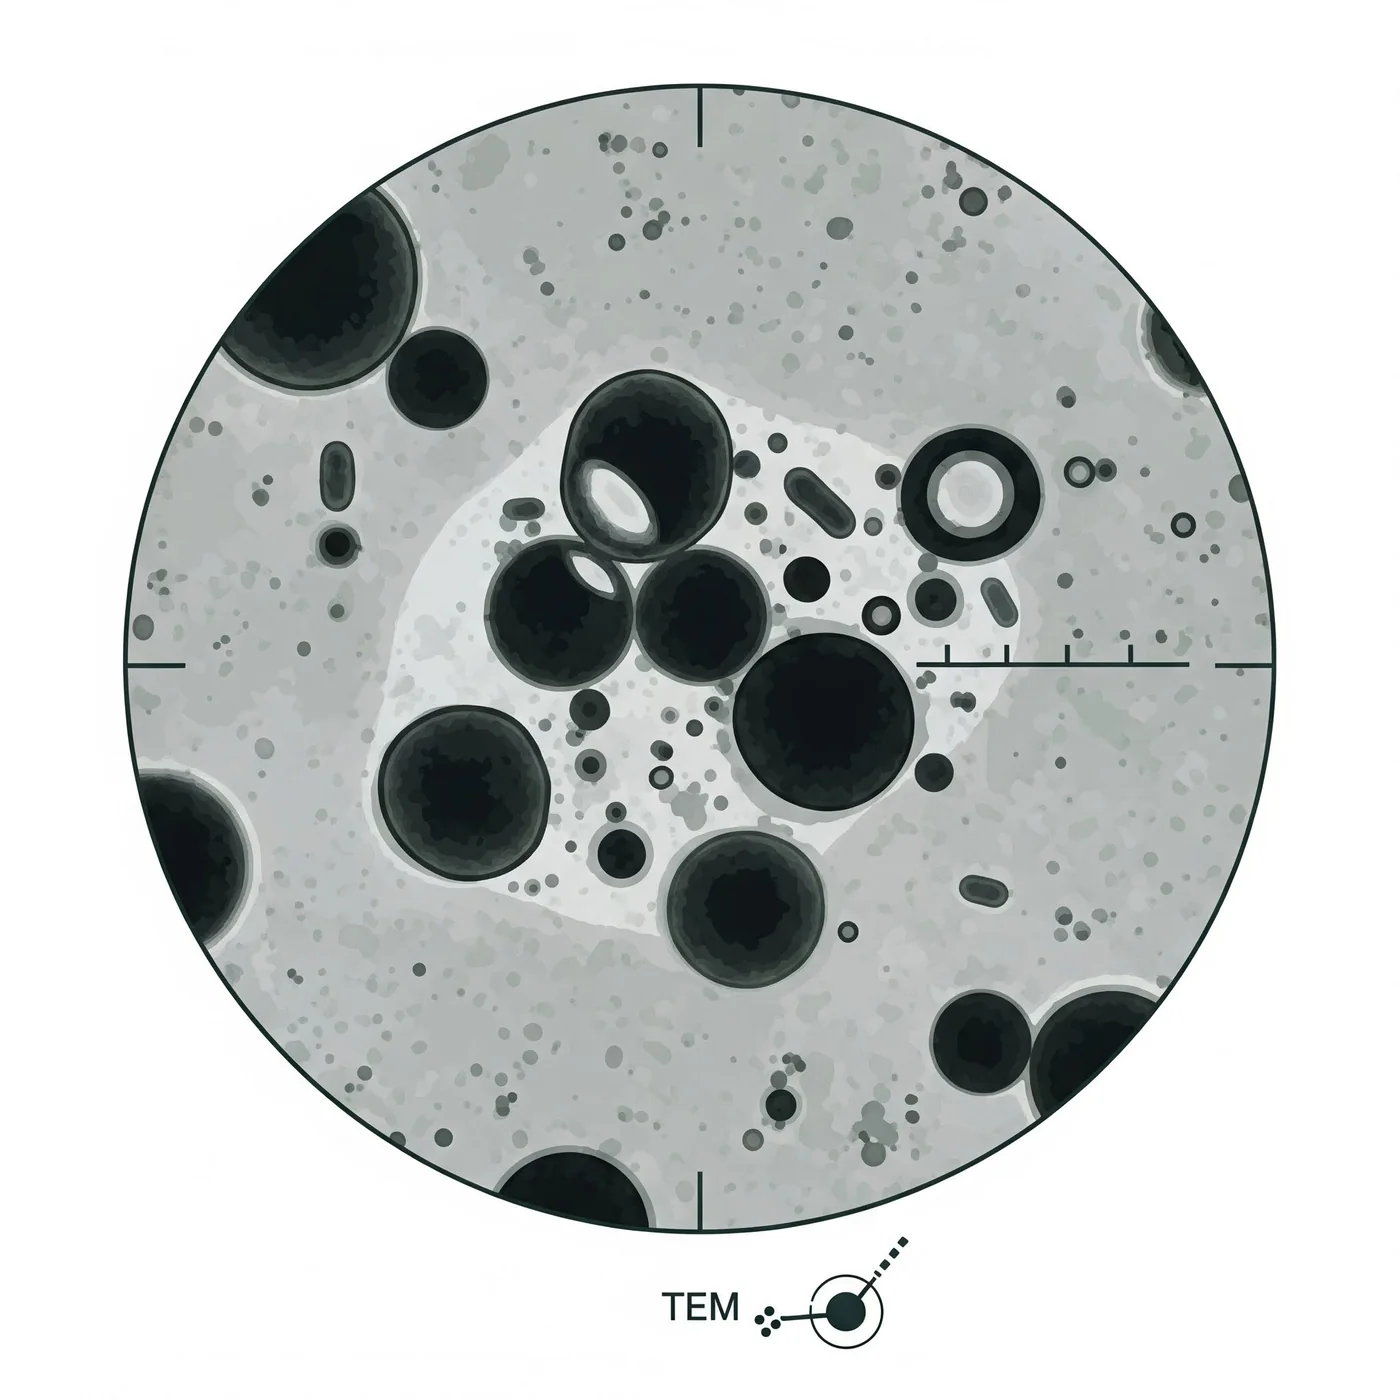
Transmission Electron Microscopy (TEM)
Internal structure, core–shell architecture and lamellarity down to ~0.2 nm.
Protocol & data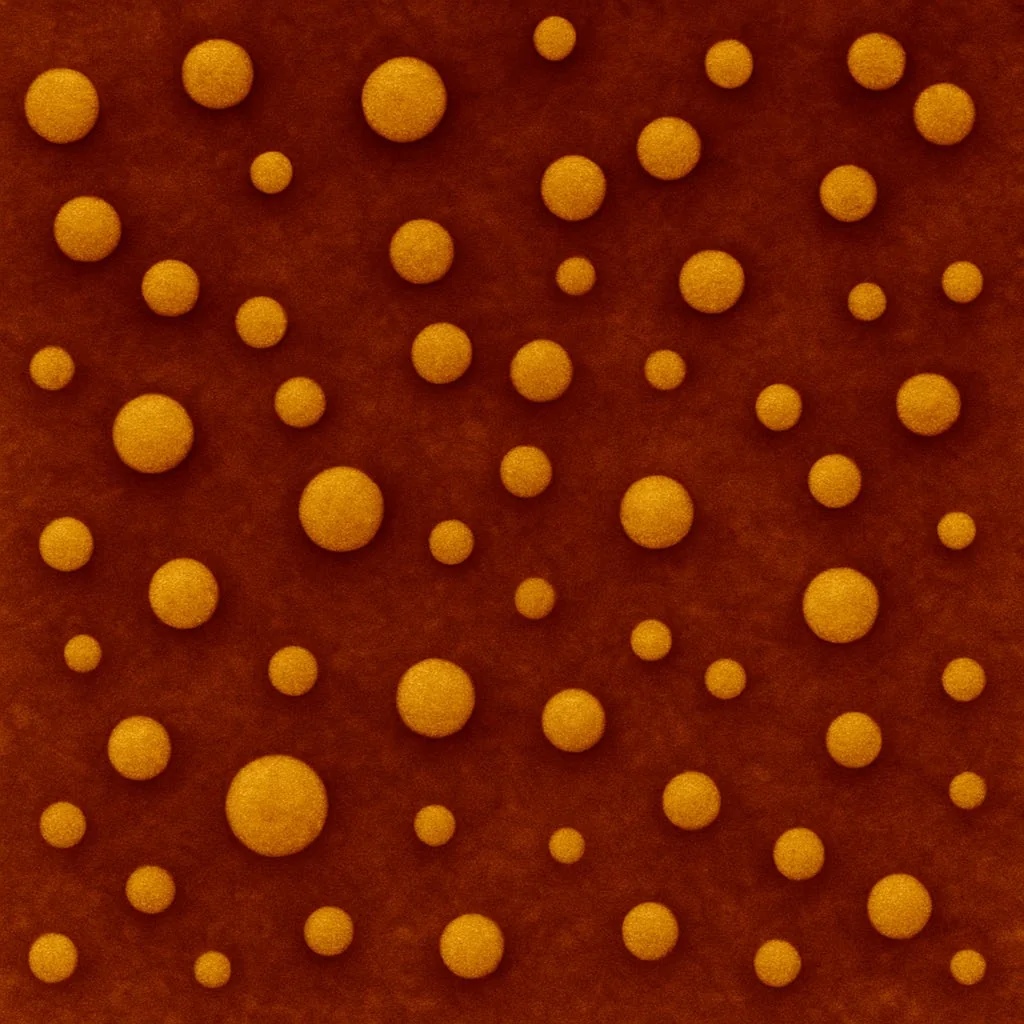
Atomic Force Microscopy (AFM)
3D surface topography, height and roughness in air or liquid — no vacuum or stain.
Protocol & data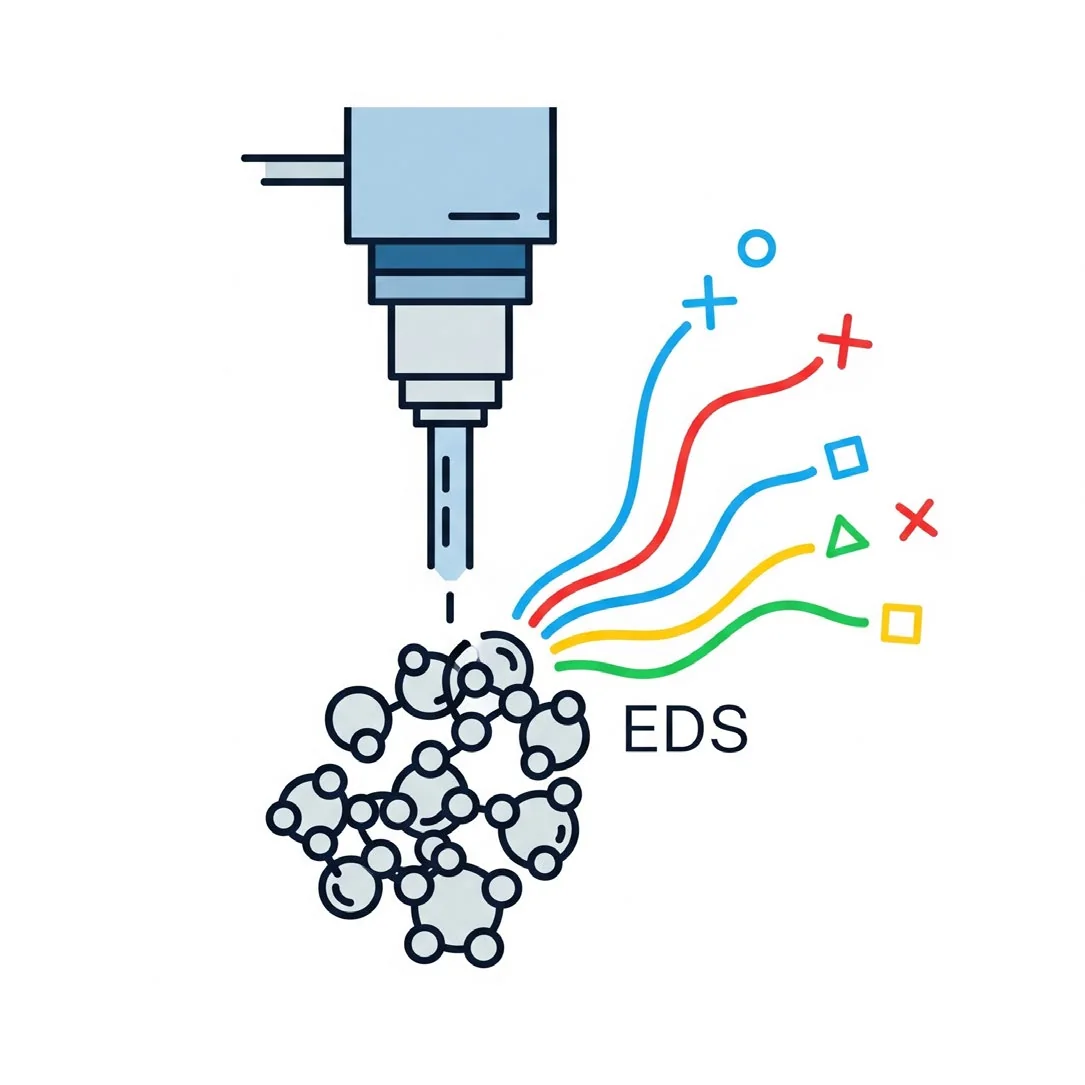
SEM-EDS (Energy-Dispersive X-ray Spectroscopy)
Elemental composition and mapping — confirming P, N, Si or metals in a carrier.
Protocol & dataNucleic Acid Binding, Loading & Release
How well a carrier binds, protects, encapsulates and releases its genetic cargo.

Fourier Transform Infrared Spectroscopy (FTIR)
Chemical fingerprint — functional groups and carrier–nucleic acid interactions.
Protocol & data
Gel Retardation (Agarose Gel Electrophoresis) Assay
Nucleic acid binding by cationic carriers and the optimal N/P ratio.
Protocol & data
Heparin Competition Assay
Complex stability against polyanions that mimic the extracellular matrix and serum.
Protocol & data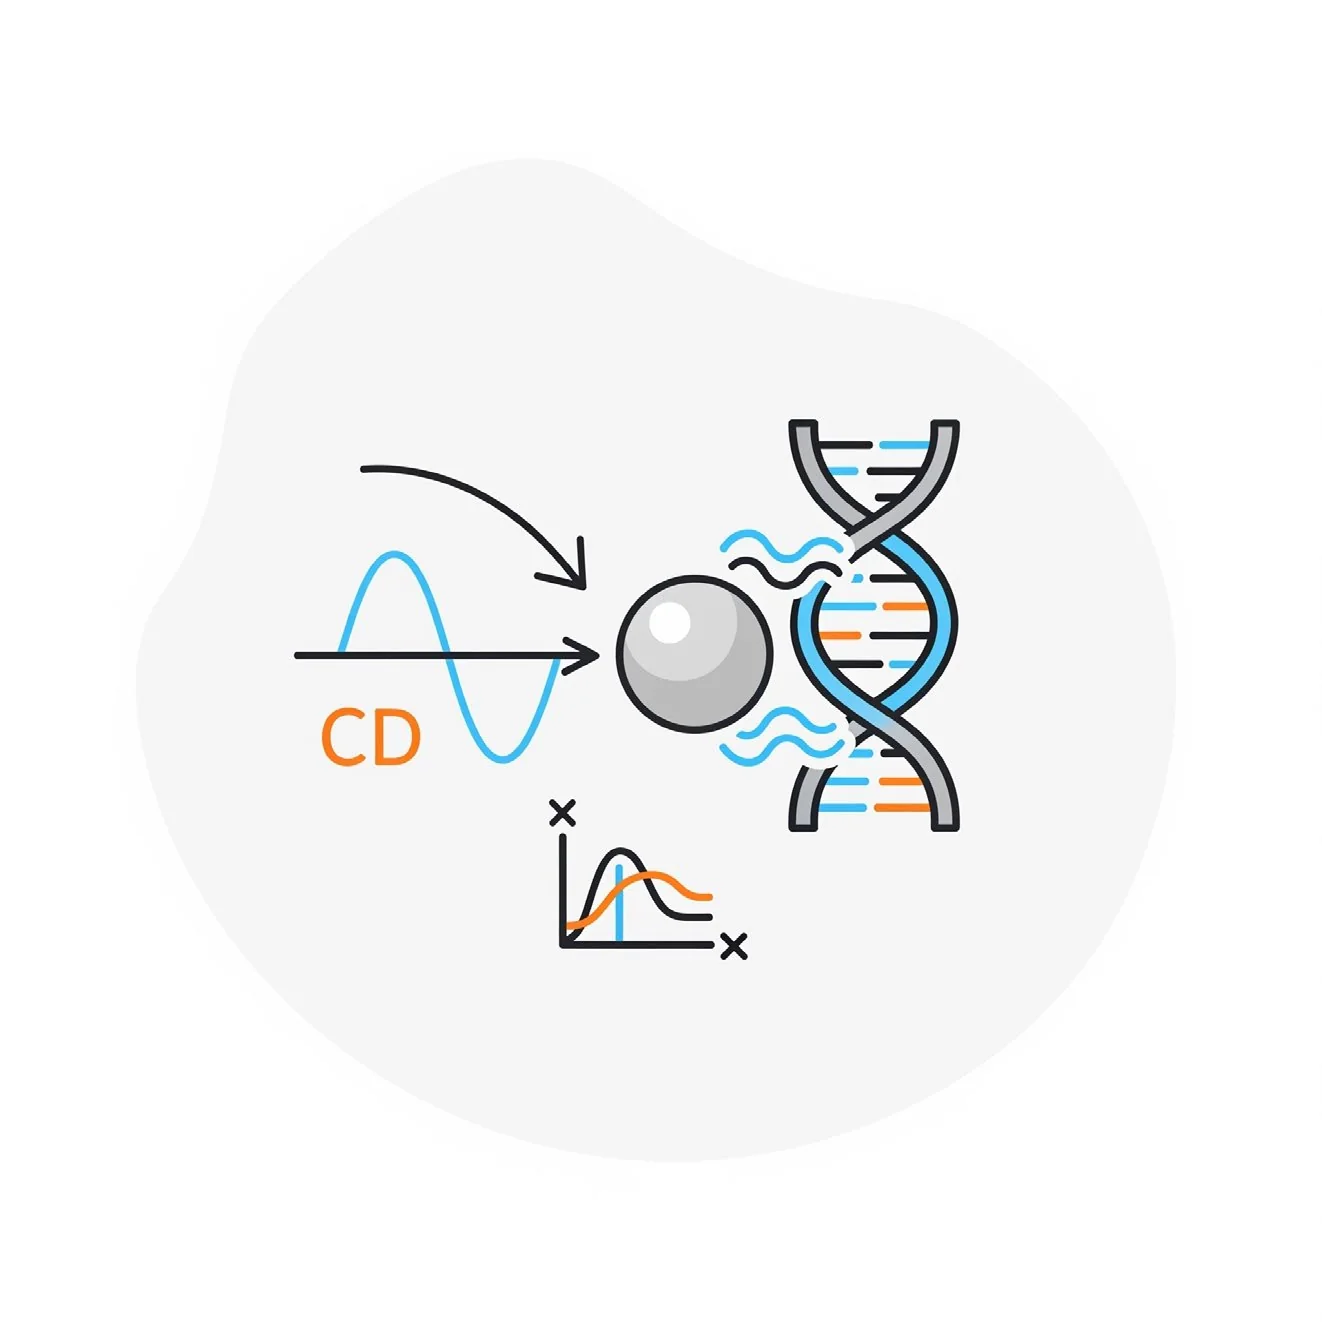
Circular Dichroism (CD) Spectroscopy
Conformational changes in DNA or siRNA upon binding to nanocarriers.
Protocol & data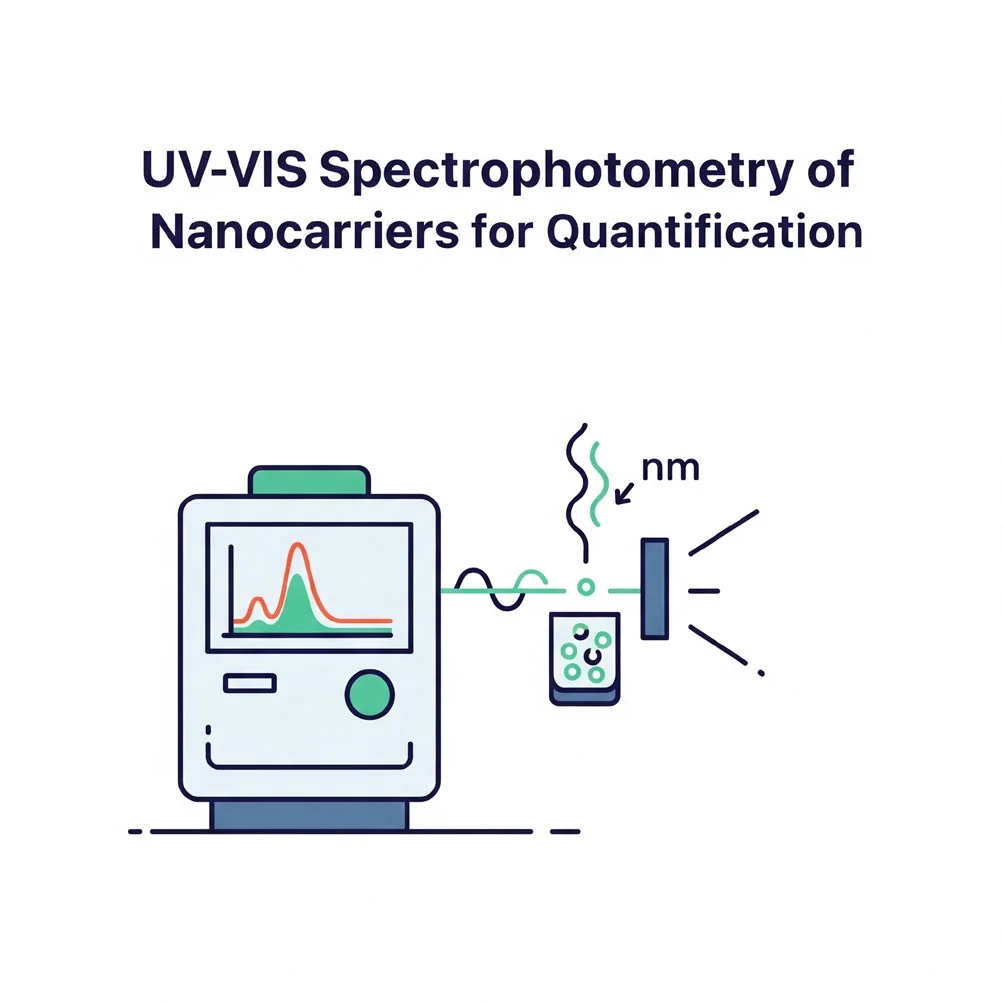
UV-Vis Spectrophotometry (Loading Efficiency & Quantification)
Nucleic acid concentration, loading capacity and encapsulation efficiency.
Protocol & data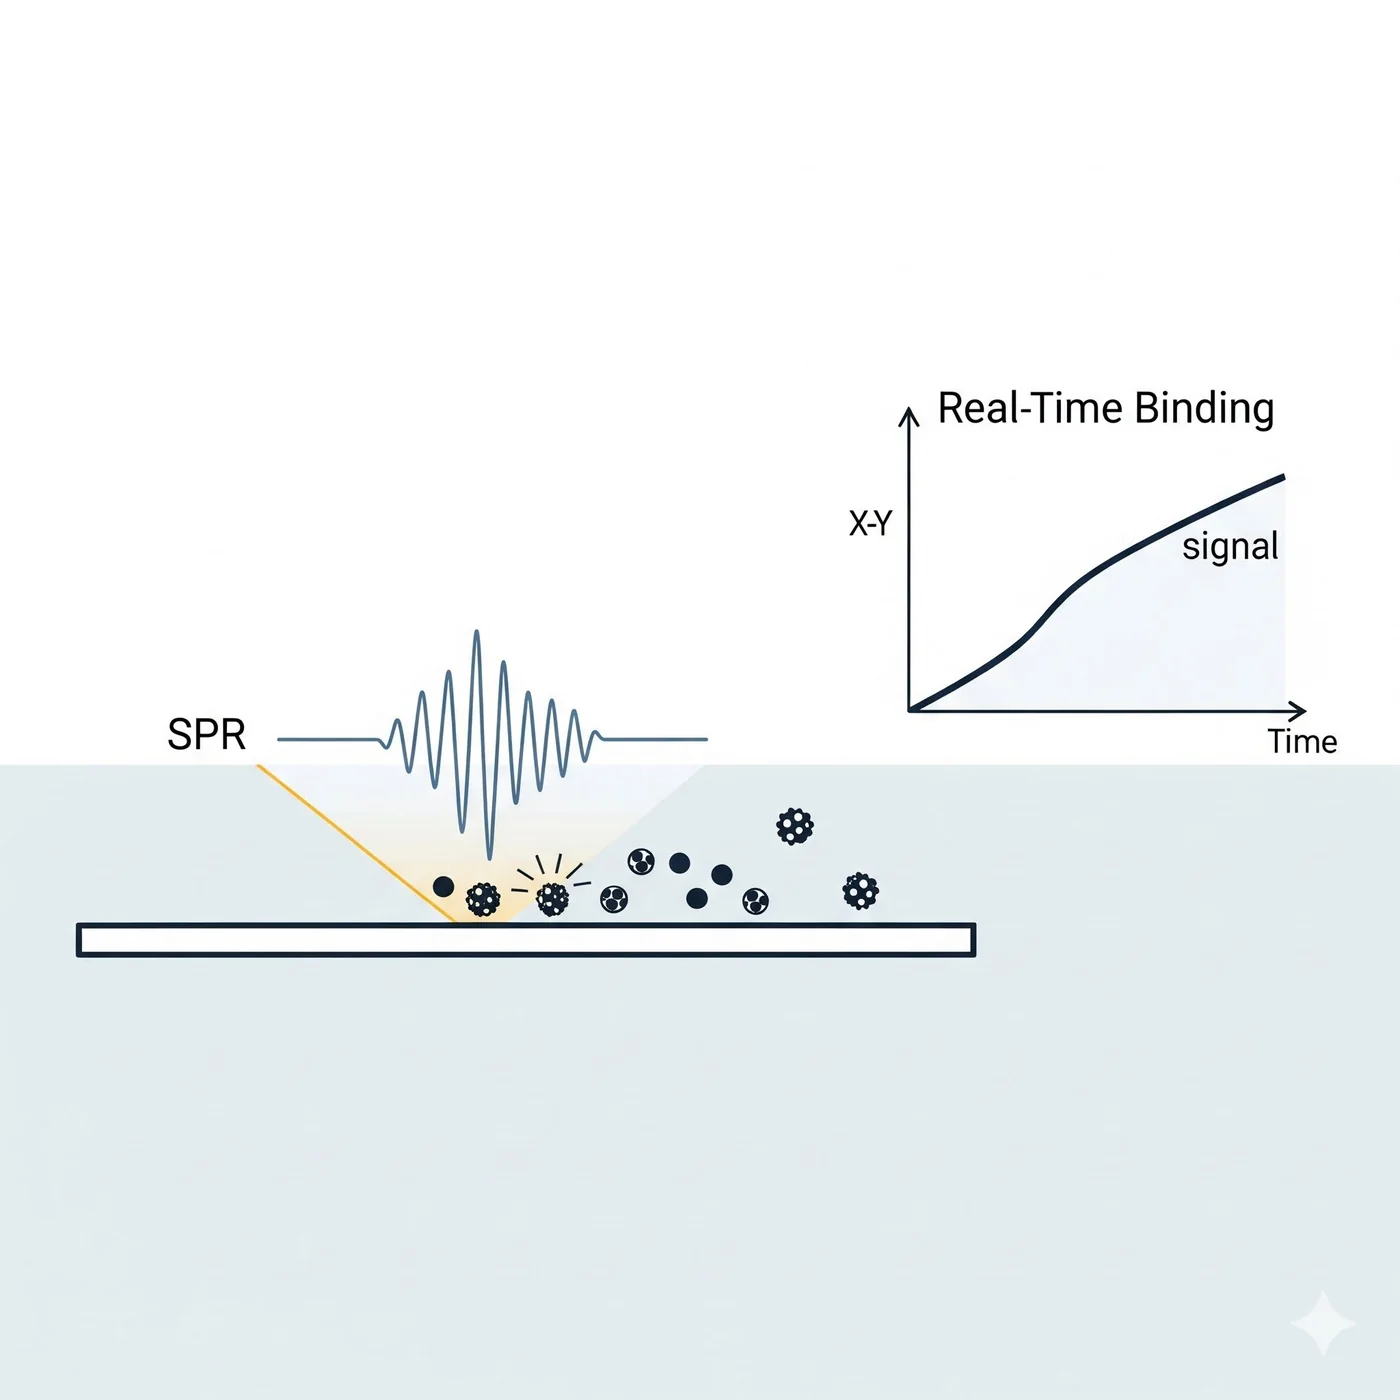
Surface Plasmon Resonance (SPR) / Quartz Crystal Microbalance (QCM-D)
Real-time binding kinetics between nanocarriers and biomolecules.
Protocol & data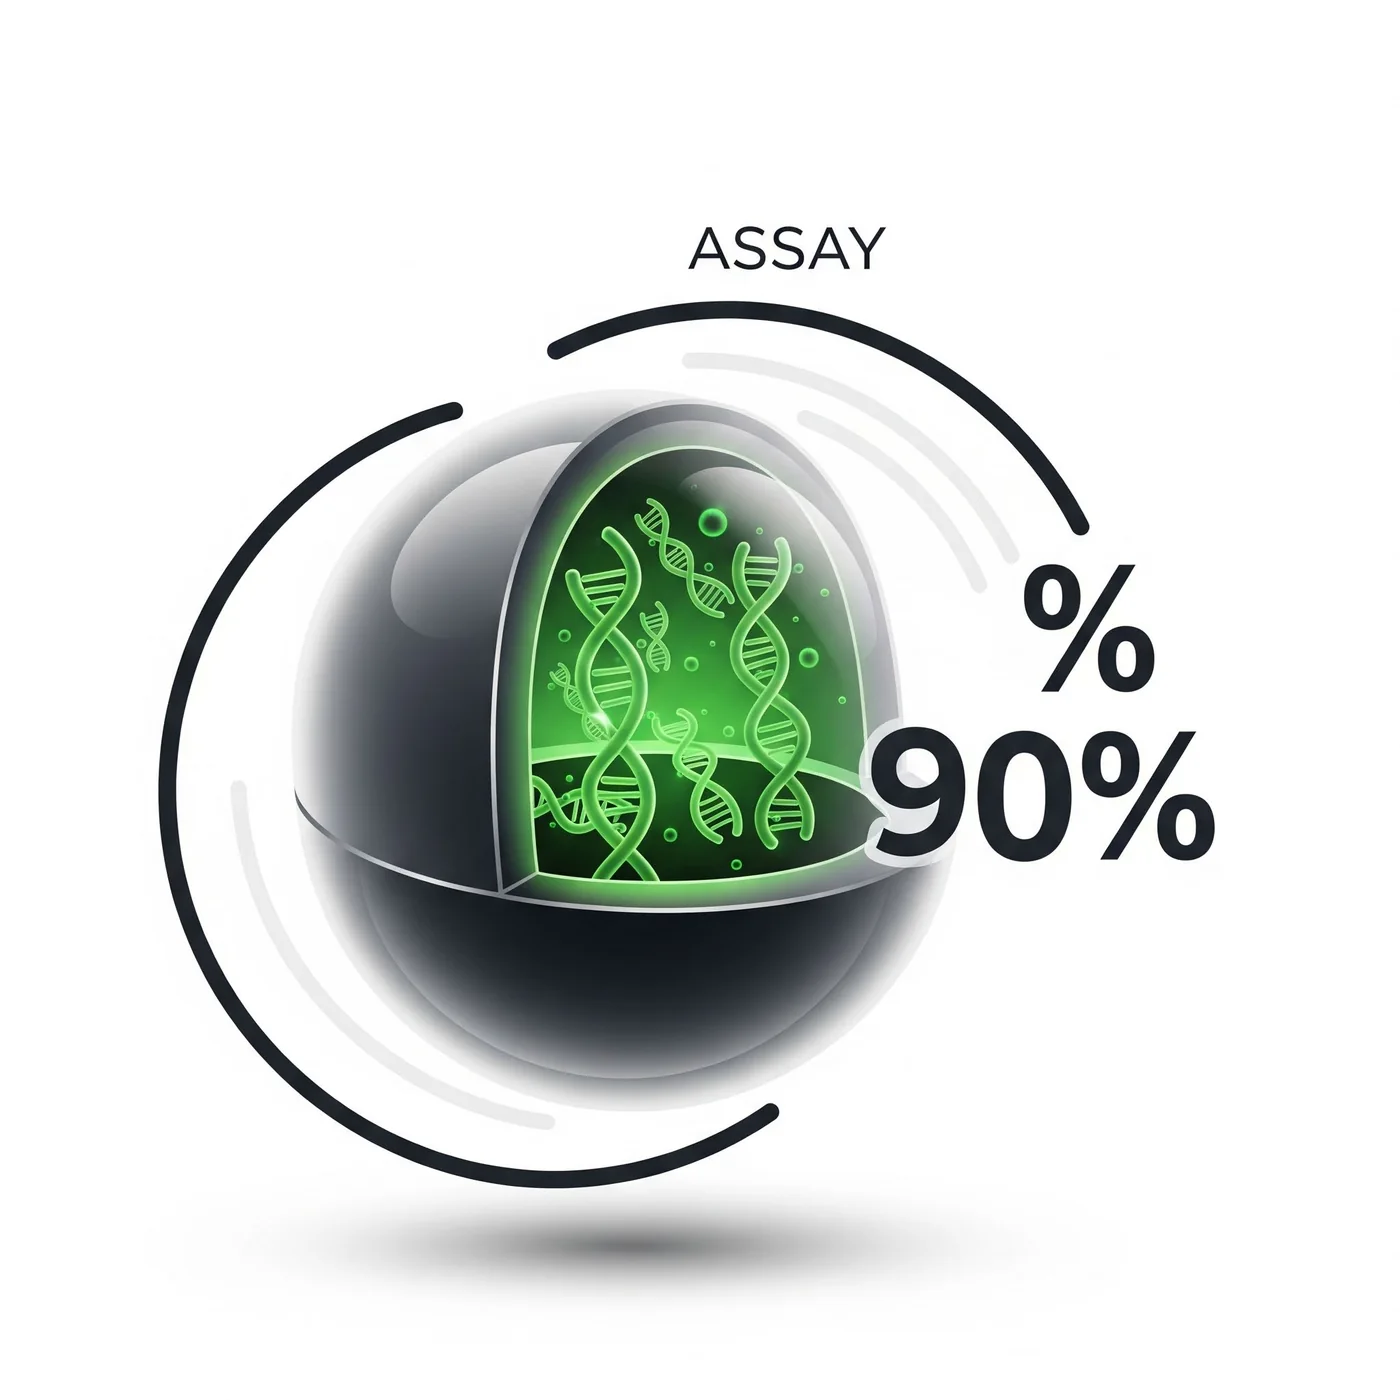
Encapsulation Efficiency (RiboGreen® / PicoGreen® Assay)
Percentage of RNA or DNA successfully encapsulated within the nanocarrier.
Protocol & data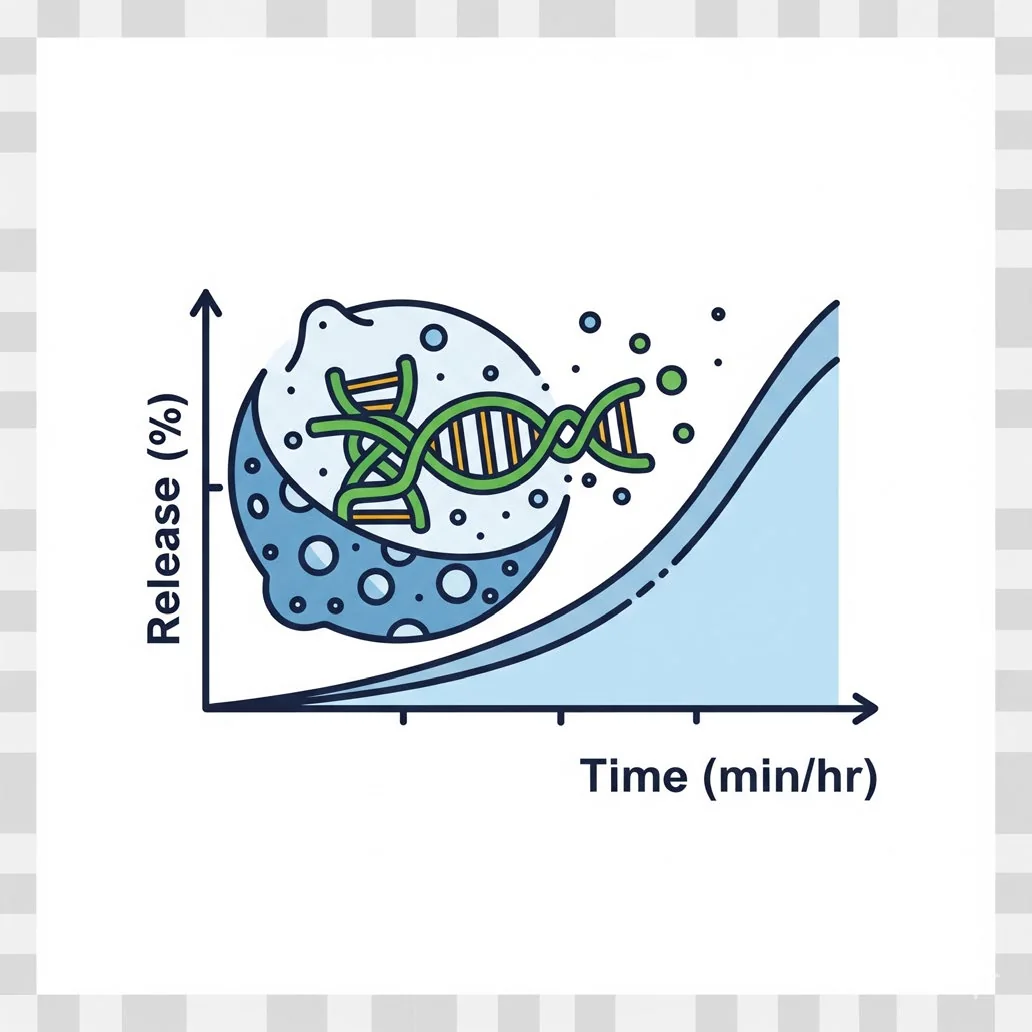
In Vitro Release Profile of Genetic Material
Release kinetics at physiological (pH 7.4) and endosomal (pH 5.5) conditions.
Protocol & dataCellular Uptake & Endocytosis
Tracking internalisation and identifying the endocytic route a carrier takes into the cell.
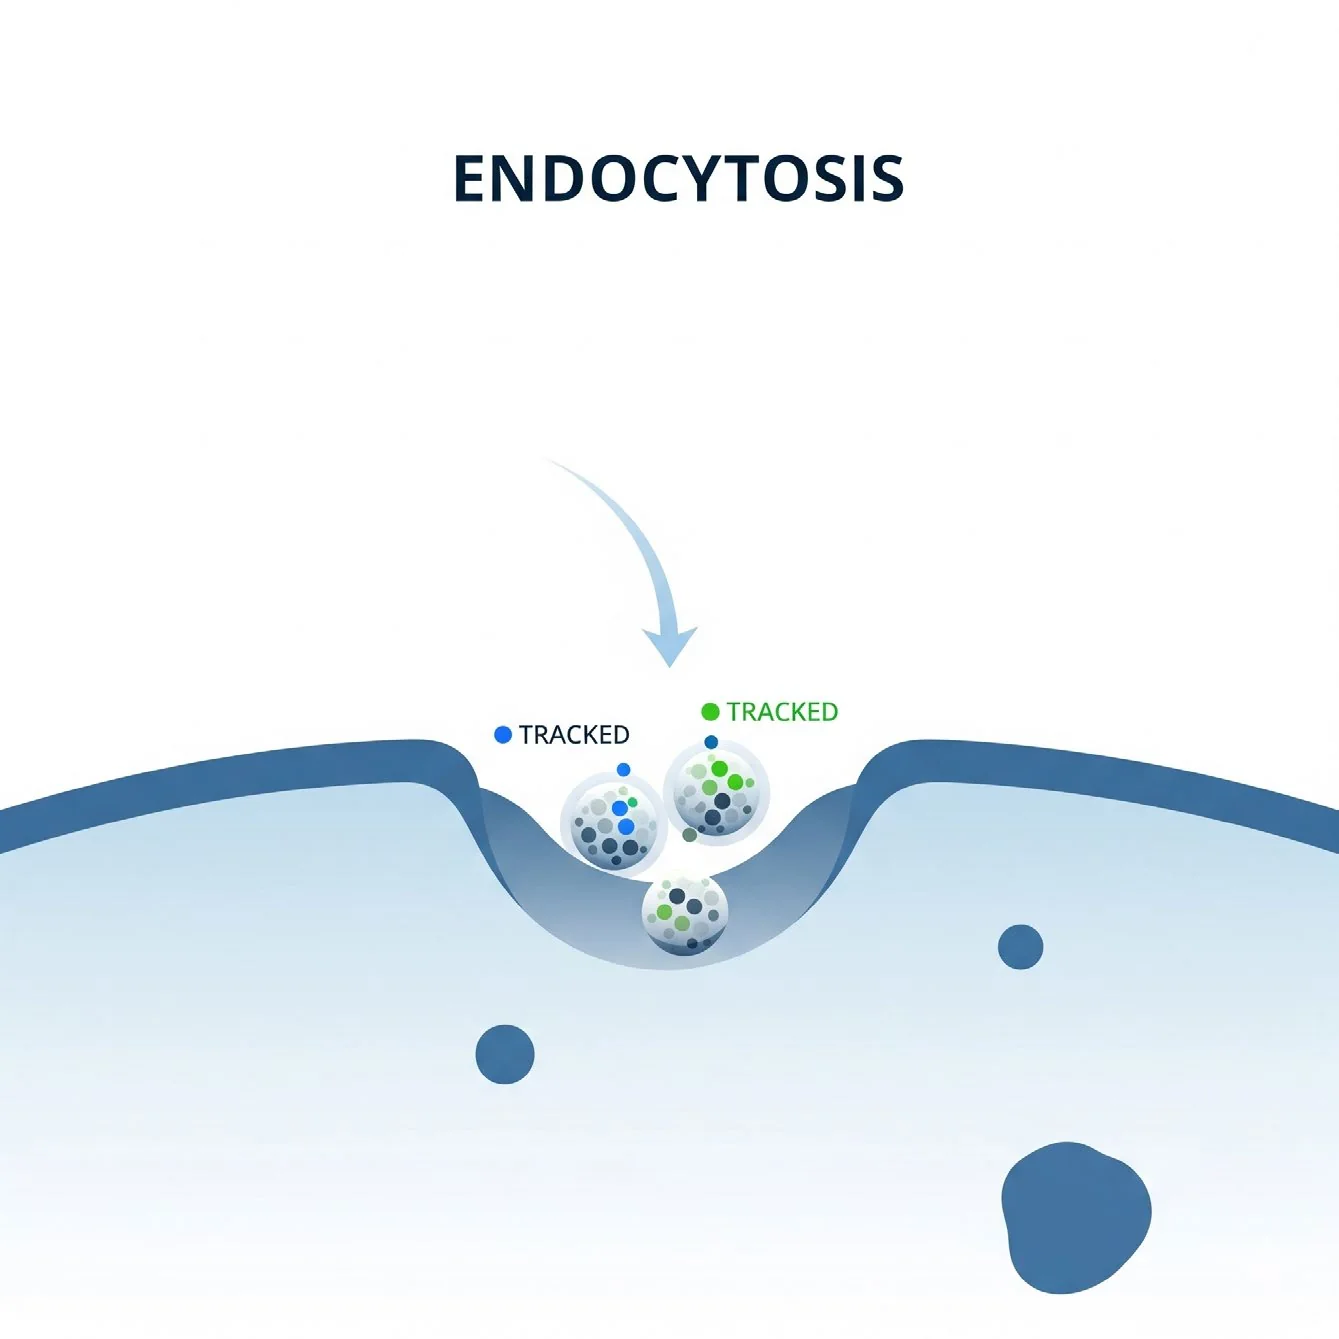
Tracking Nanocarriers in Endocytosis with Labeled Nanocarriers
Fluorescently labelled carriers followed through cellular uptake over time.
Protocol & data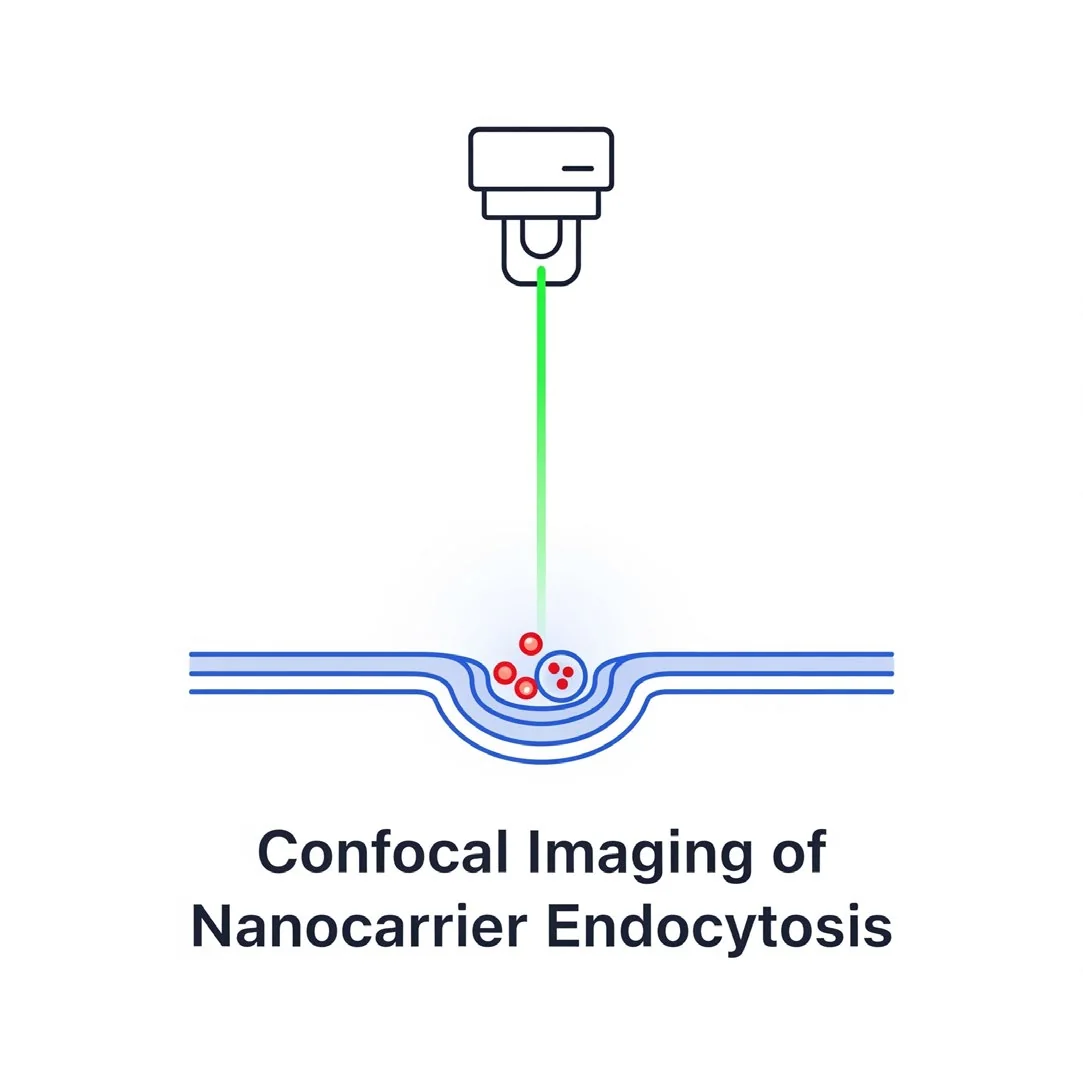
Confocal Imaging of Nanocarrier Endocytosis
Optical sectioning and 3D localisation of carriers relative to organelles.
Protocol & data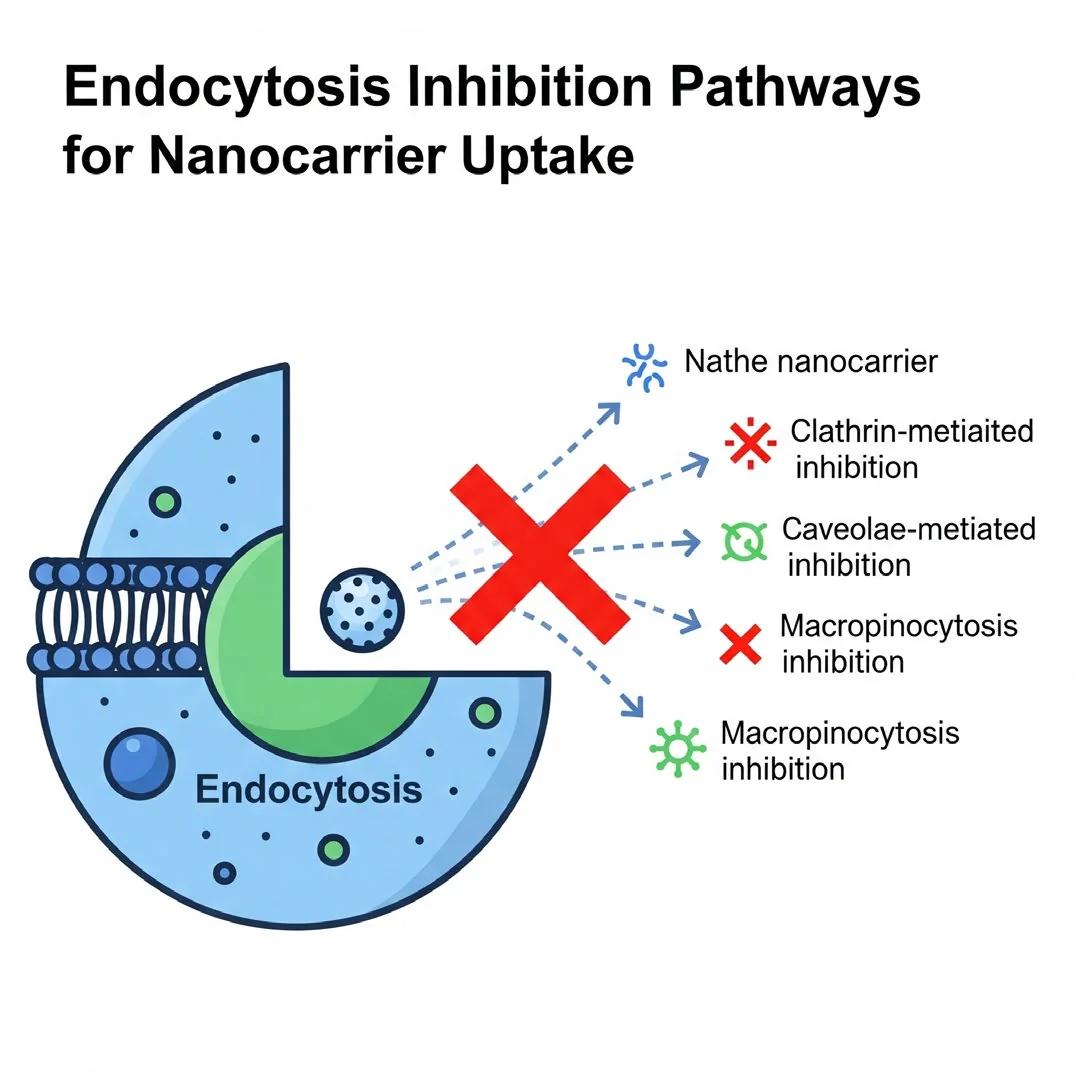
Endocytosis Inhibition Pathways for Nanocarrier Uptake
Pharmacological inhibitors reveal which endocytic route a carrier uses.
Protocol & dataTransfection Efficiency
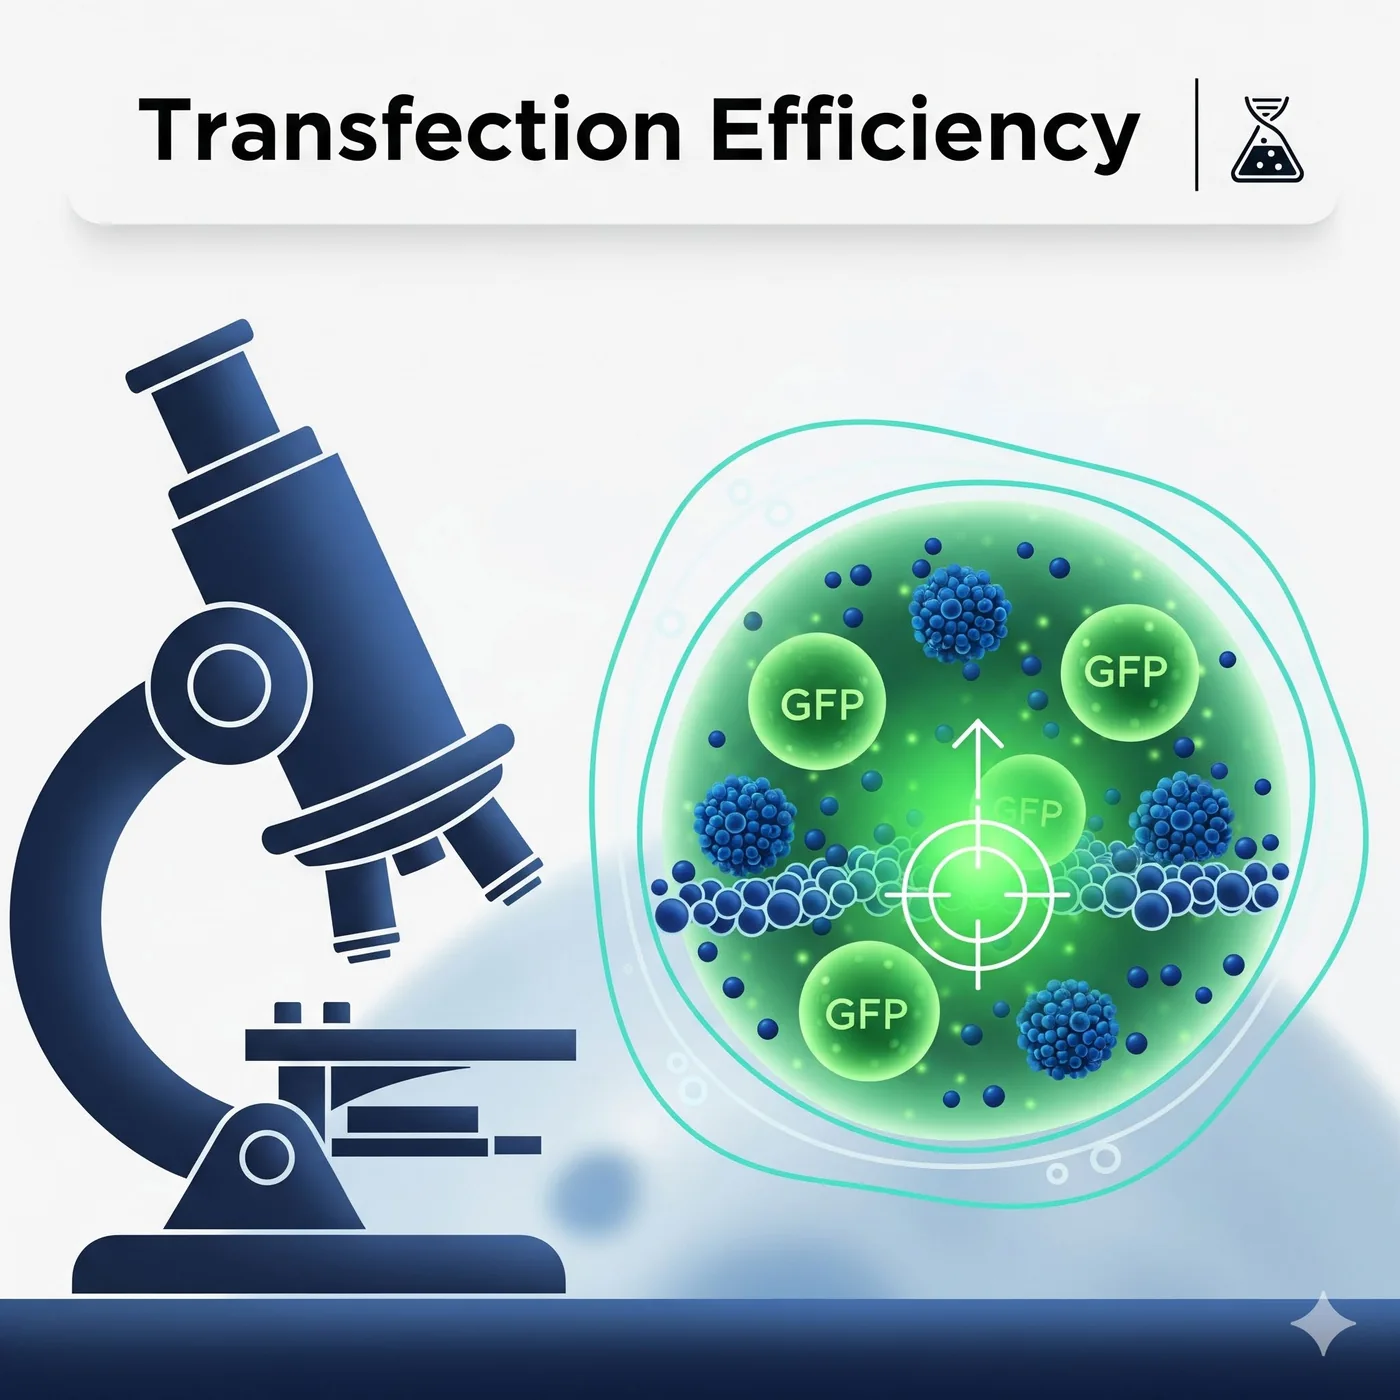
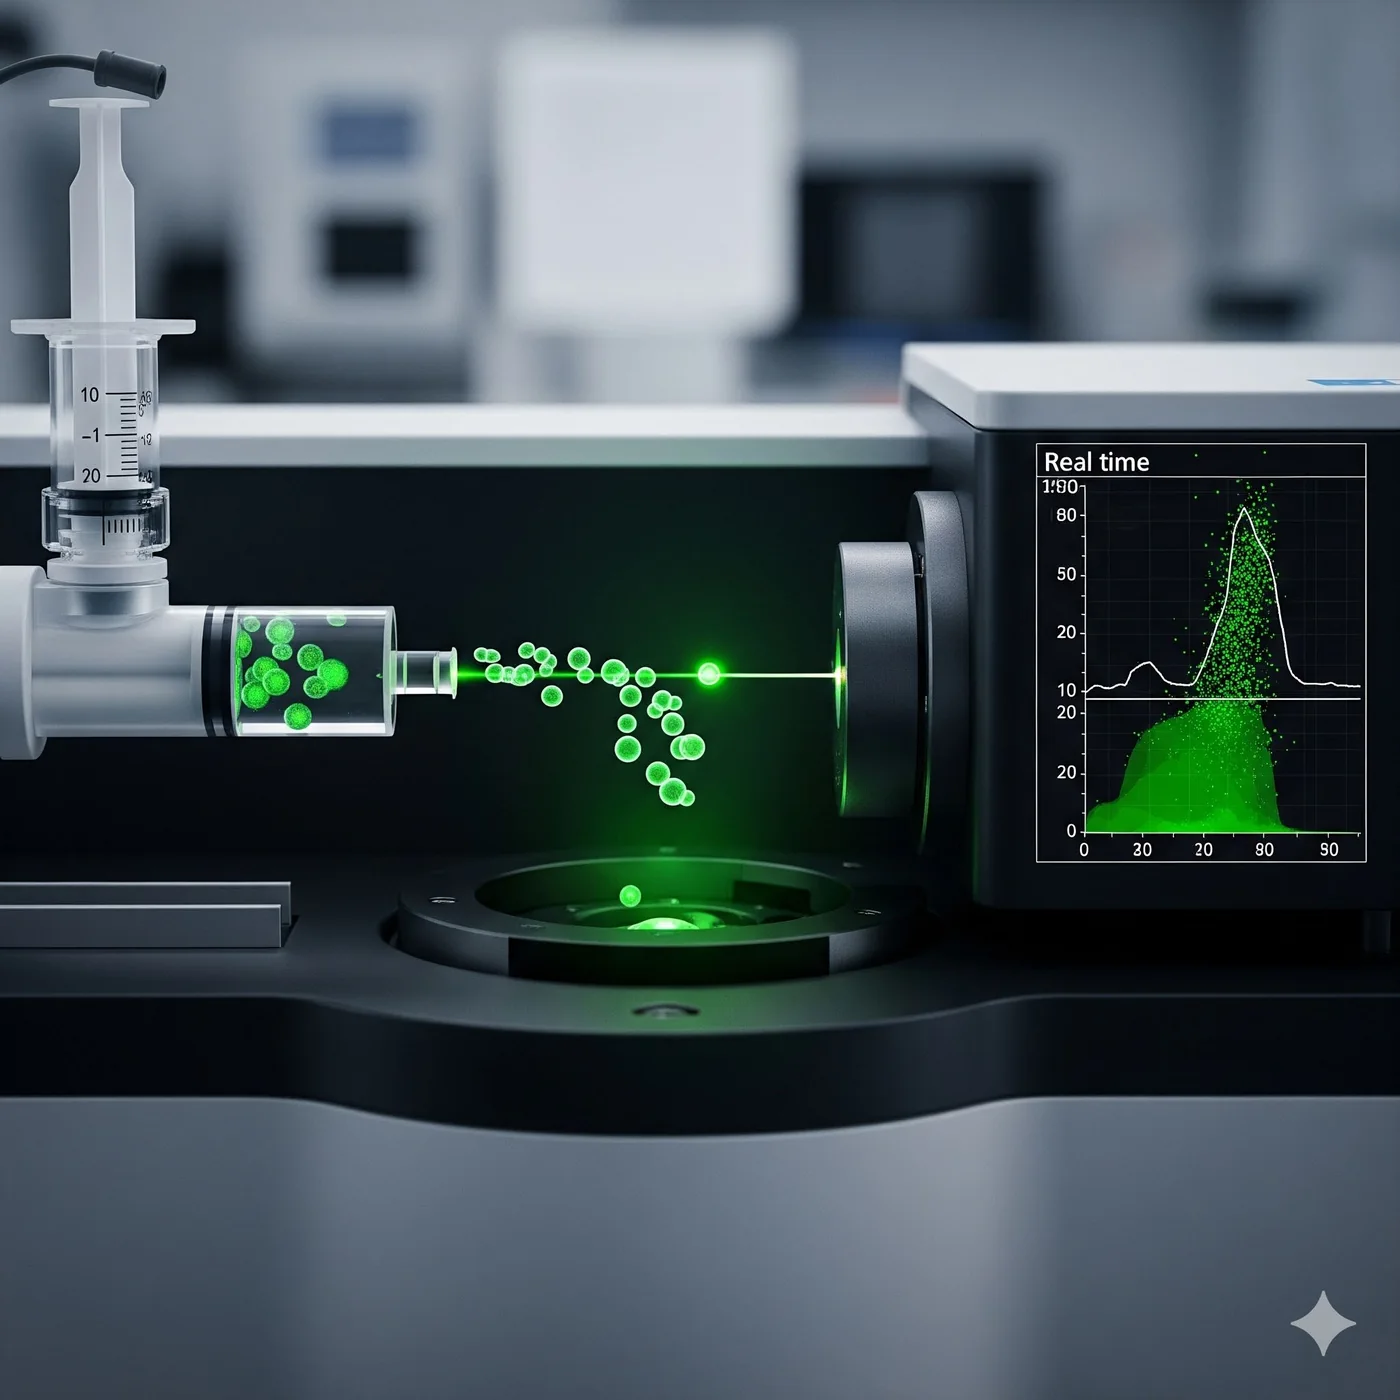
The functional readout: how many cells express the delivered gene, and how strongly.
Cytotoxicity & Biocompatibility
Ensuring high transfection rates do not come at the cost of cellular health.
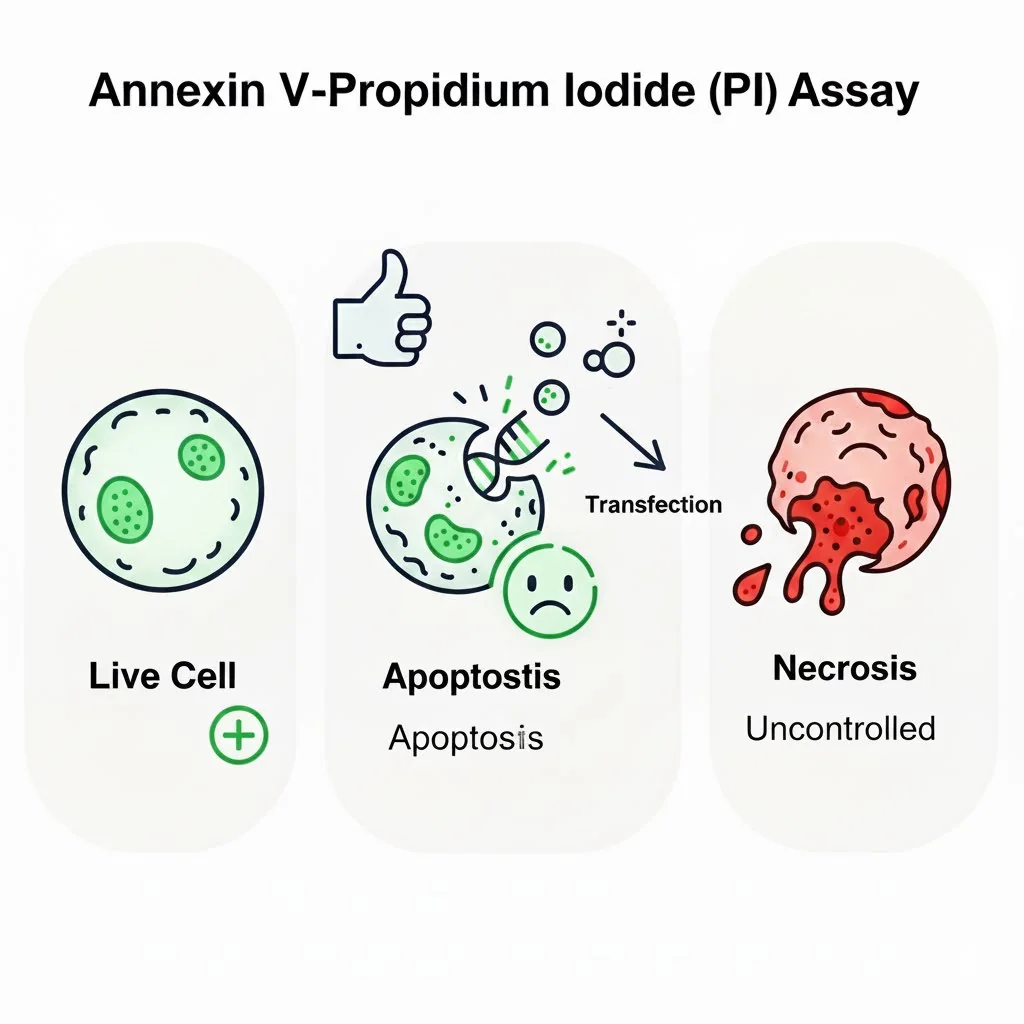
Annexin V – Propidium Iodide (PI) Assay
Distinguishes live, early apoptotic, late apoptotic and necrotic cells.
Protocol & data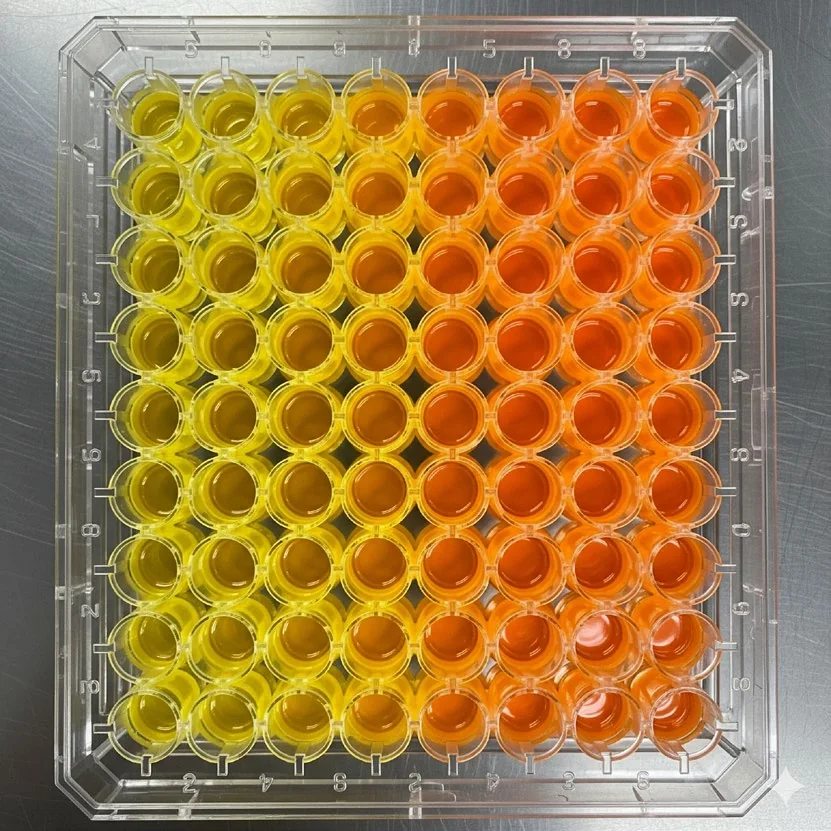
MTS Assay
Metabolic activity as an indicator of cell viability — no solubilisation step.
Protocol & data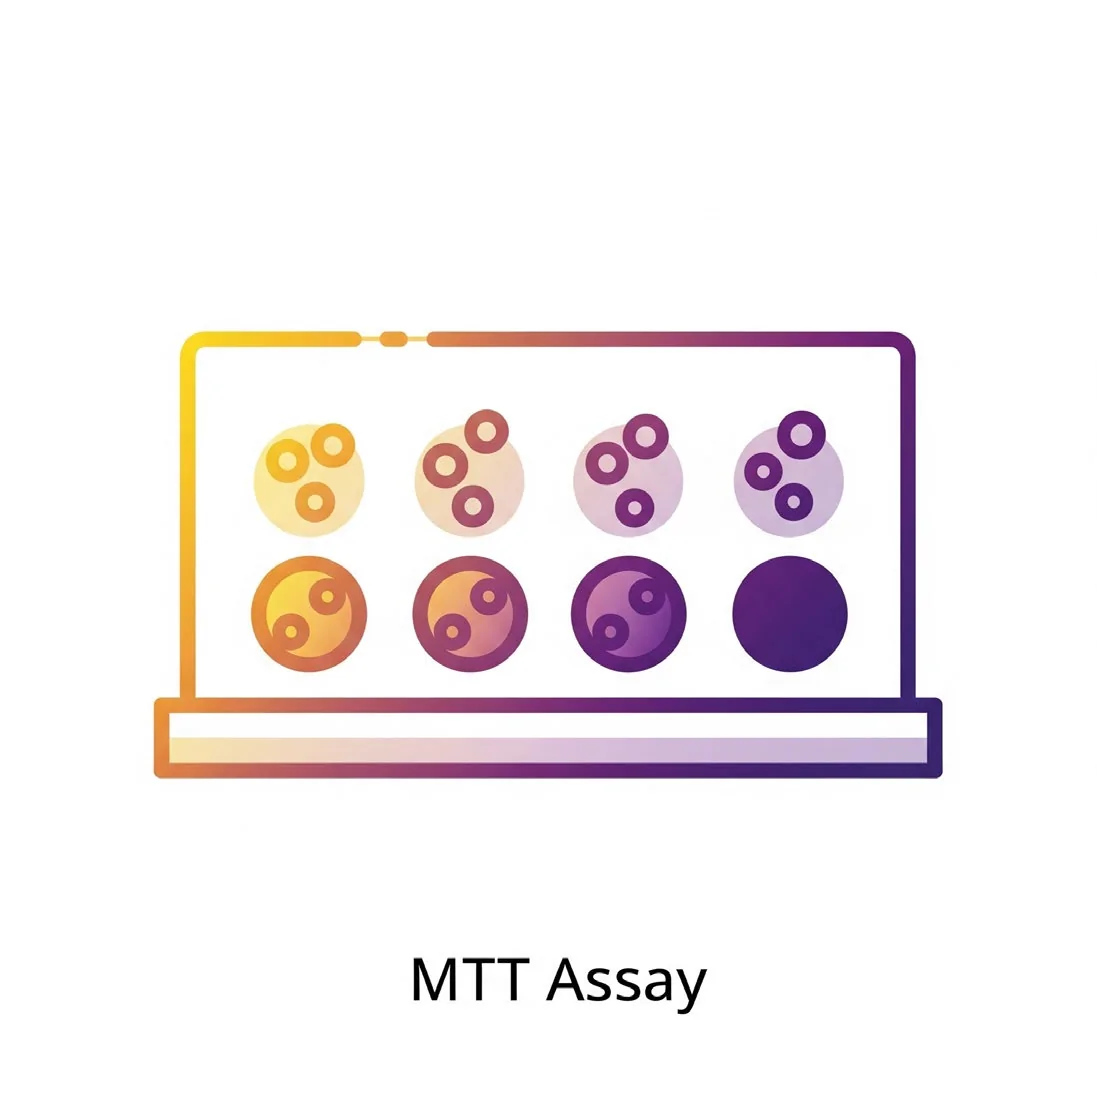
MTT Assay
Mitochondrial dehydrogenase activity measured via solubilised formazan.
Protocol & data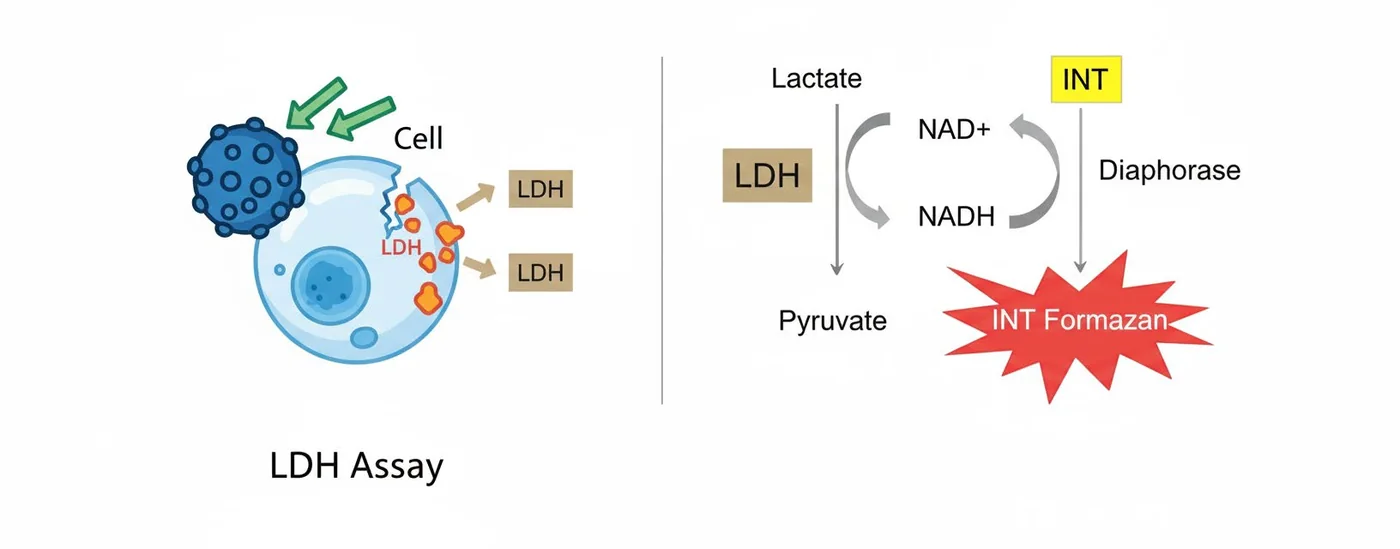
LDH Assay (Lactate Dehydrogenase)
Membrane damage measured by LDH released into the culture medium.
Protocol & data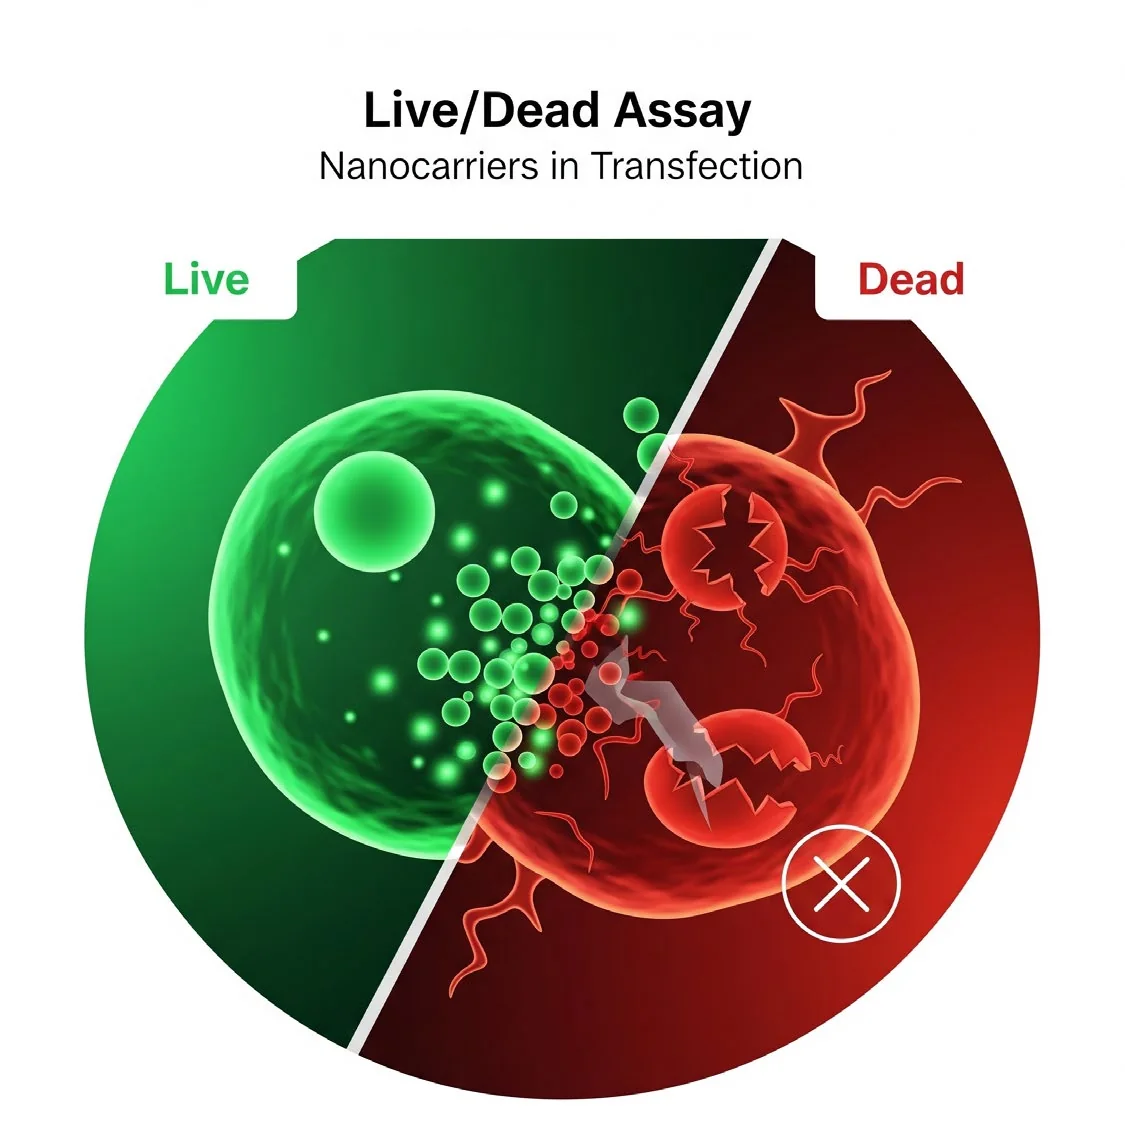
Live/Dead Assay
Two-colour fluorescence imaging of live (green) versus dead (red) cells.
Protocol & dataWhat a complete transfection-reagent evaluation covers
Polymer or lipid characterization
For synthetic vectors, the chemical structure, molecular weight, degree of branching (in polymers), phase transition temperature (in lipids) and biodegradability are key parameters that influence transfection performance and biocompatibility.
Nucleic acid loading and complexation
Assessing how effectively the reagent binds and condenses nucleic acids — through gel retardation assays, dye exclusion or fluorescence quenching — ensures protection during delivery and controlled release inside the cell.
In vitro cellular uptake
Using fluorescently labelled nucleic acids or carriers, flow cytometry and confocal microscopy allow visualisation and quantification of internalisation pathways (e.g., endocytosis) and intracellular trafficking.
Transfection efficiency
The ultimate functional readout, measured by reporter gene expression (e.g., GFP, luciferase), qPCR or functional knockdown (for siRNA), reveals how effectively the delivered genetic material is expressed or silences target genes.
Cytotoxicity and biocompatibility
MTT, LDH or live/dead assays evaluate cell viability and membrane integrity, ensuring that high transfection rates do not come at the cost of cellular health.
Serum stability and storage
Real-world applicability requires testing performance in serum-containing media and under various storage conditions to assess robustness and shelf life.
Cell line specificity and scalability
Evaluations across different cell types (adherent, suspension, primary, stem cells) help determine the versatility and limitations of a given reagent.
Comparison of techniques
Particle characterization techniques
| Parameter | DLS | Zeta potential | NTA |
|---|---|---|---|
| Measures | Size (Z-average), PDI | Surface charge (mV) | Size & concentration (per particle) |
| Sample volume | ~700 μL | ~300 μL | ~1 mL |
| Concentration range | Moderate | Moderate | Low to moderate |
| Output | Average size, PDI | mV (charge) | Size distribution + particles/mL |
| Best for | Quick size screening | Stability & interaction | Heterogeneous samples, concentration |
Microscopy & microanalysis techniques
| Technique | Resolution | Environment | Information provided | Best for |
|---|---|---|---|---|
| SEM | 1–10 nm | Vacuum | Surface morphology, size, aggregation | Quick imaging of dry nanoparticles |
| TEM | 0.2–2 nm | Vacuum | Internal structure, lamellarity, shape | High-res imaging, core-shell systems |
| AFM | ~1 nm (vertical) | Air or liquid | 3D topography, height, roughness | Soft materials, height accuracy, liquid imaging |
| SEM-EDS | ~1 μm (spatial) | Vacuum | Elemental composition & mapping | Confirming P, N, metals in complexes |
Cell viability & cytotoxicity assays
| Assay | Measured parameter | Detection | Readout | Key advantage | Key limitation |
|---|---|---|---|---|---|
| MTS | Metabolic activity | Colorimetric | Absorbance | Homogeneous; no lysis | Less sensitive than MTT |
| MTT | Metabolic activity | Colorimetric | Absorbance | Widely used, low cost | Requires solubilisation step |
| LDH | Membrane integrity (death) | Colorimetric | Absorbance | Measures cytotoxicity directly | Does not detect early apoptosis |
| Live/Dead | Viability (live vs dead) | Fluorescence | Microscopy / flow | Spatial, visual, real-time | Semi-quantitative |
Let's engineer the next delivery breakthrough together
We co-develop nanocarrier and biosensing programs with pharma, biotech and academic groups — from target selection through GMP supply.