
Transfection Efficiency
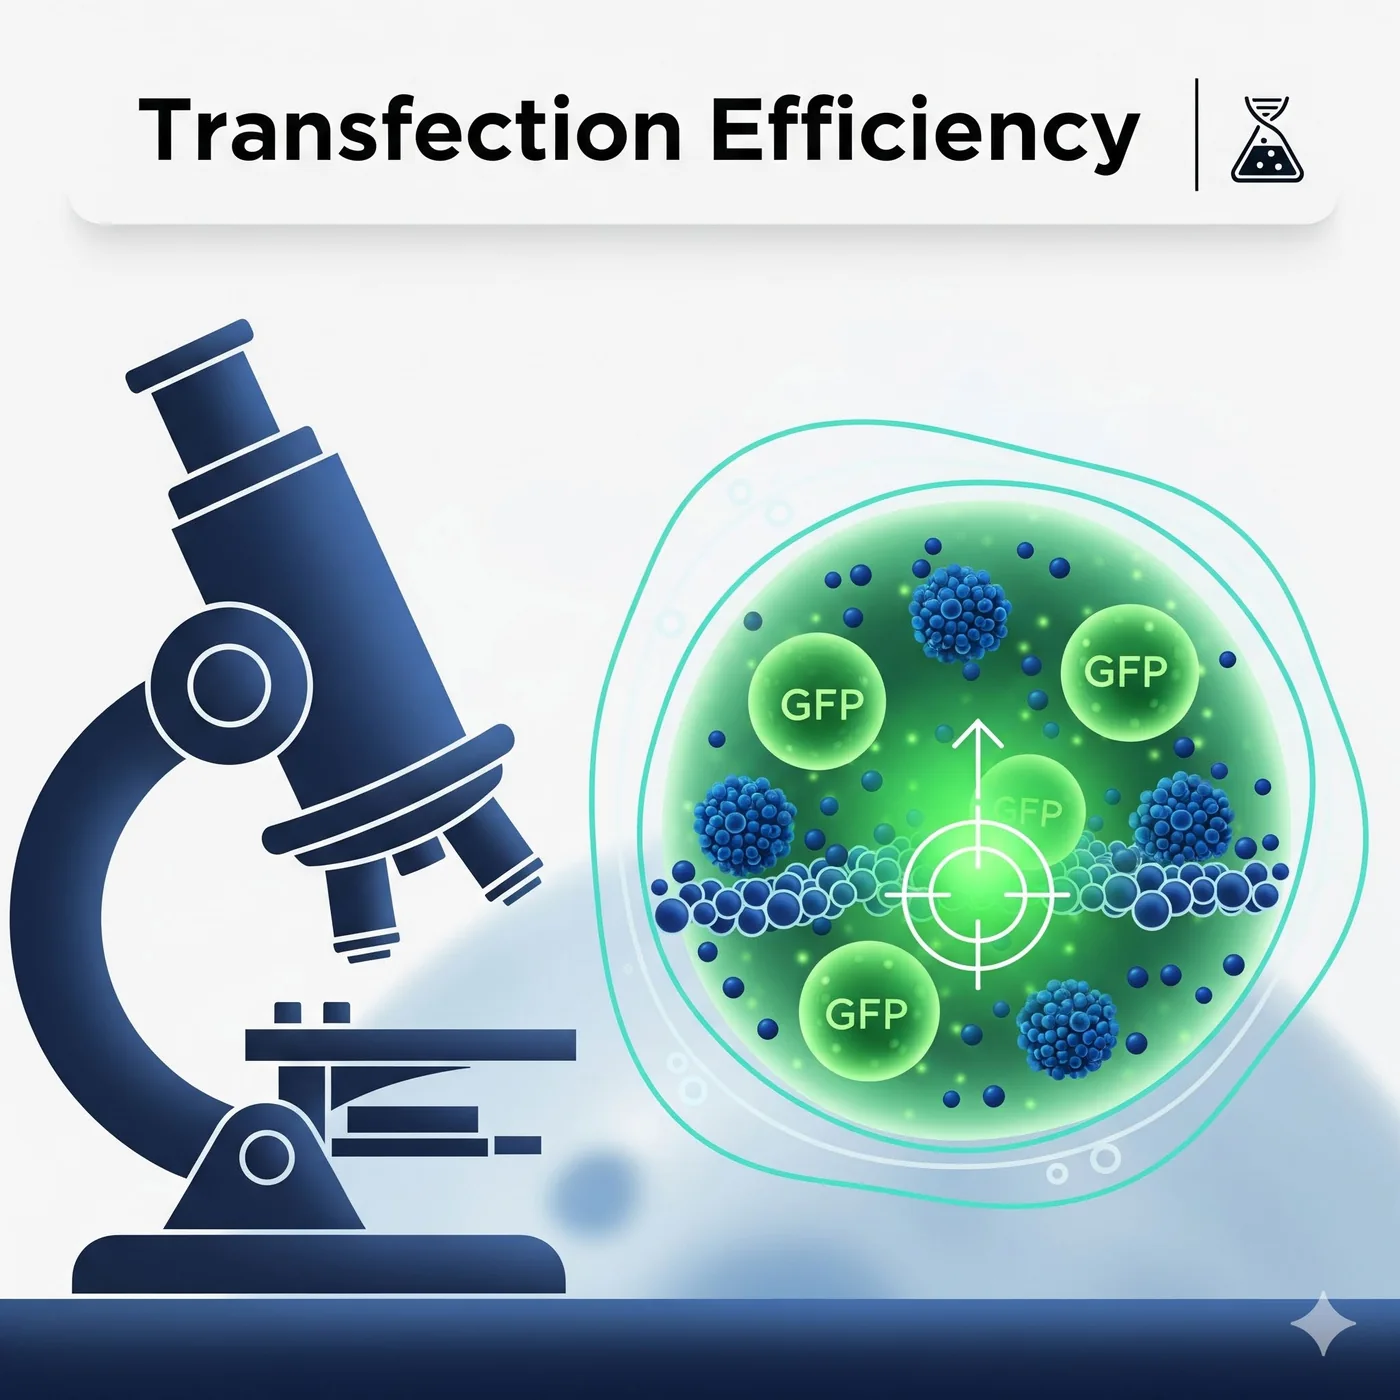
Transfection Efficiency by Fluorescence Microscopy (GFP)
Qualitative and semi-quantitative percentage of cells expressing GFP.
Purpose
To qualitatively and semi-quantitatively assess the percentage of cells expressing a transgene (e.g., GFP) after delivery via nanocarriers.
Principle
Nanocarriers deliver plasmid DNA encoding green fluorescent protein (GFP) into cells. After 24–72 hours, GFP expression is visualised under a fluorescence microscope.
Standard protocol
- 1
Transfection
- Seed cells in multi-well plates (e.g., 24-well) at ~60% confluency.
- Prepare nanocarrier–GFP plasmid complexes (optimise N/P or weight ratio).
- Incubate complexes in serum-free medium for 15–30 min.
- Add complexes dropwise to cells. Incubate 4–6 h, then replace with complete medium.
- 2
Incubation: return cells to 37 °C, 5% CO₂ for 24–72 h.
- 3
Imaging
- Observe cells under the fluorescence microscope.
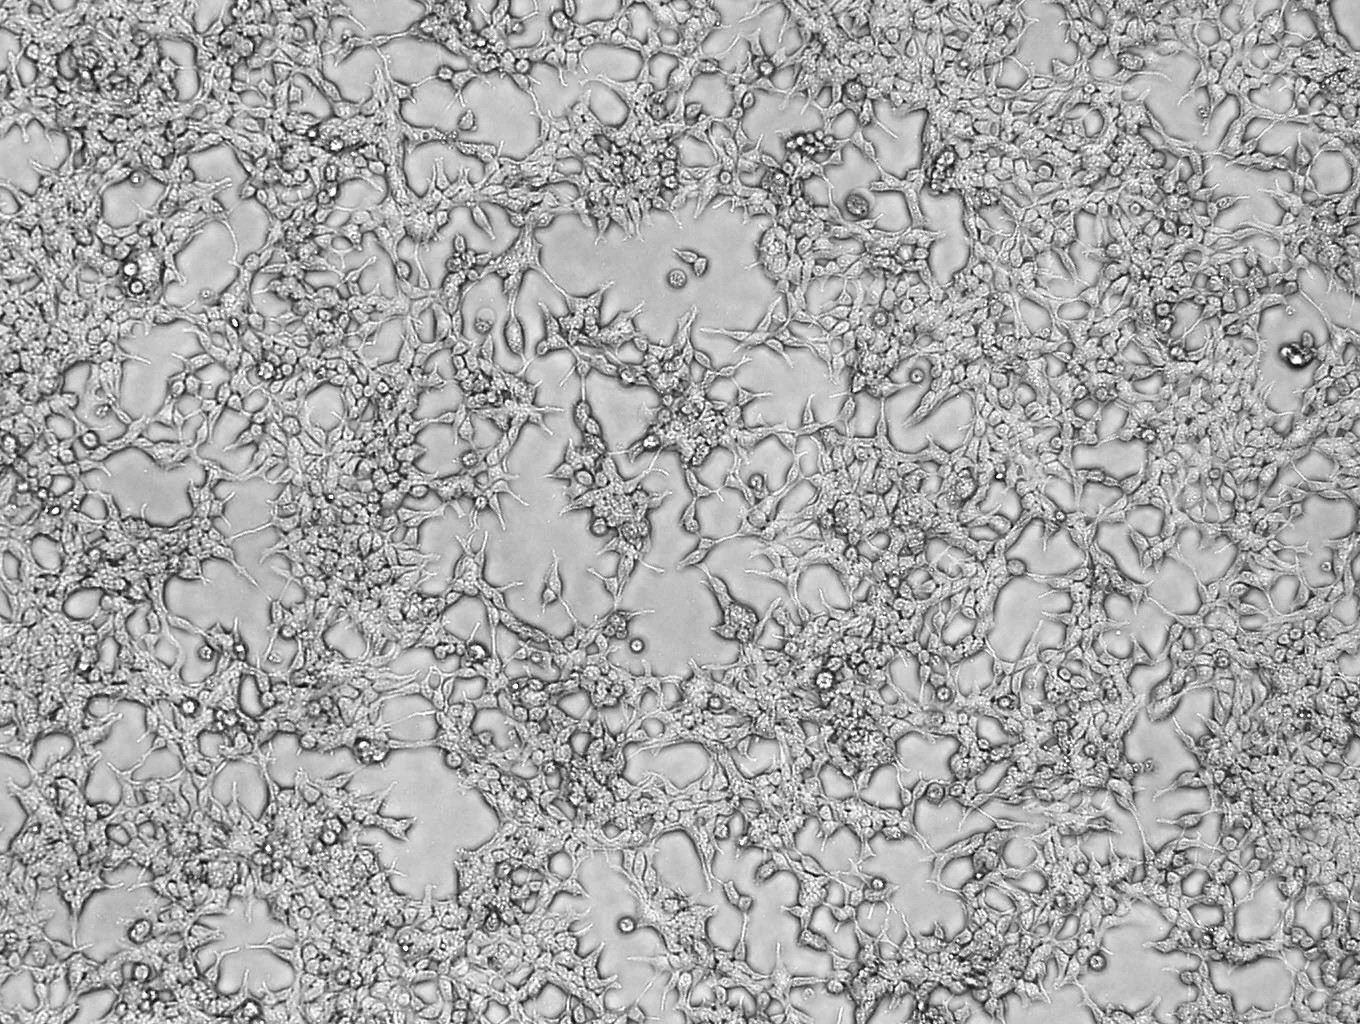
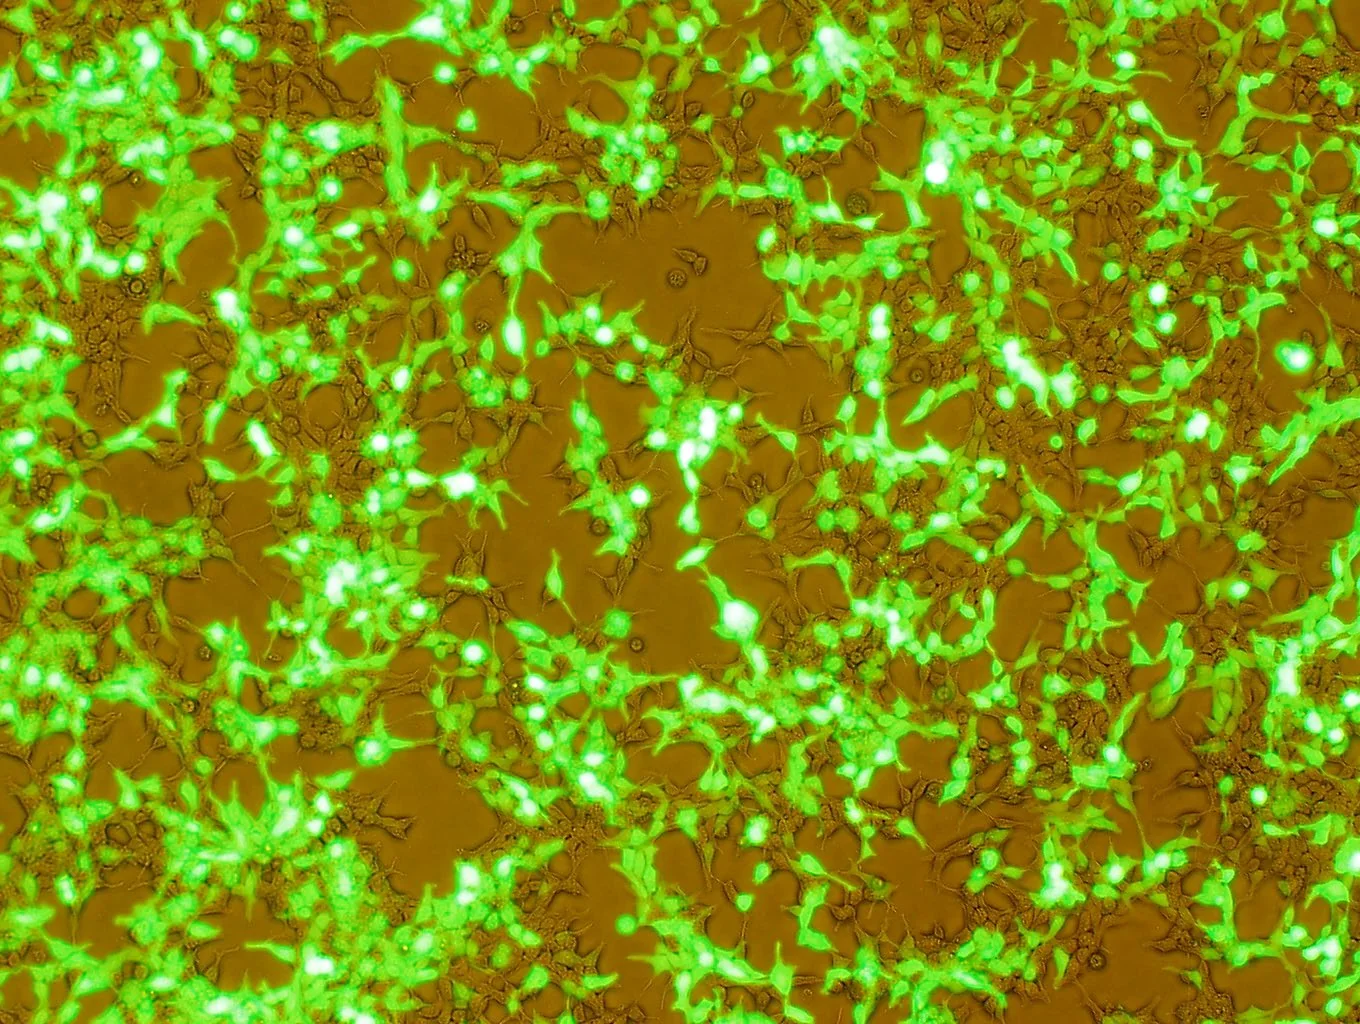
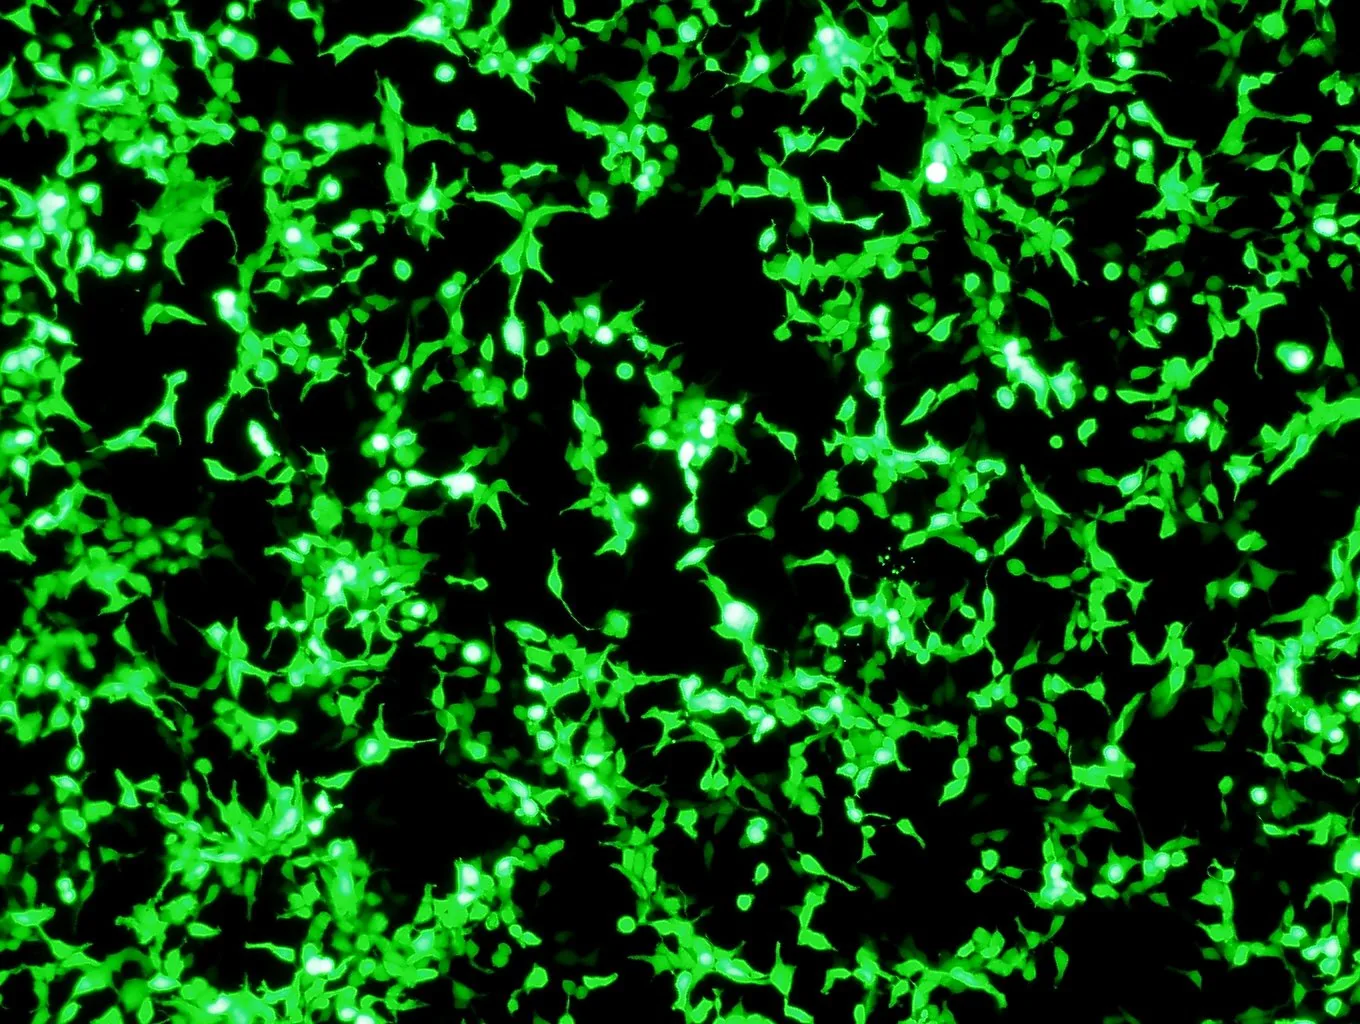
- Take bright-field and GFP channel images.
- 4
Analysis
- Count total cells (DAPI or bright field) vs. GFP-positive cells in multiple fields.
Transfection efficiency
Efficiency (%) = (Number of GFP⁺ cells ÷ Total cells) × 100
Representative data
Let's engineer the next delivery breakthrough together
We co-develop nanocarrier and biosensing programs with pharma, biotech and academic groups — from target selection through GMP supply.