
Tracking Nanocarriers in Endocytosis with Labeled Nanocarriers
Fluorescently labelled carriers followed through cellular uptake over time.
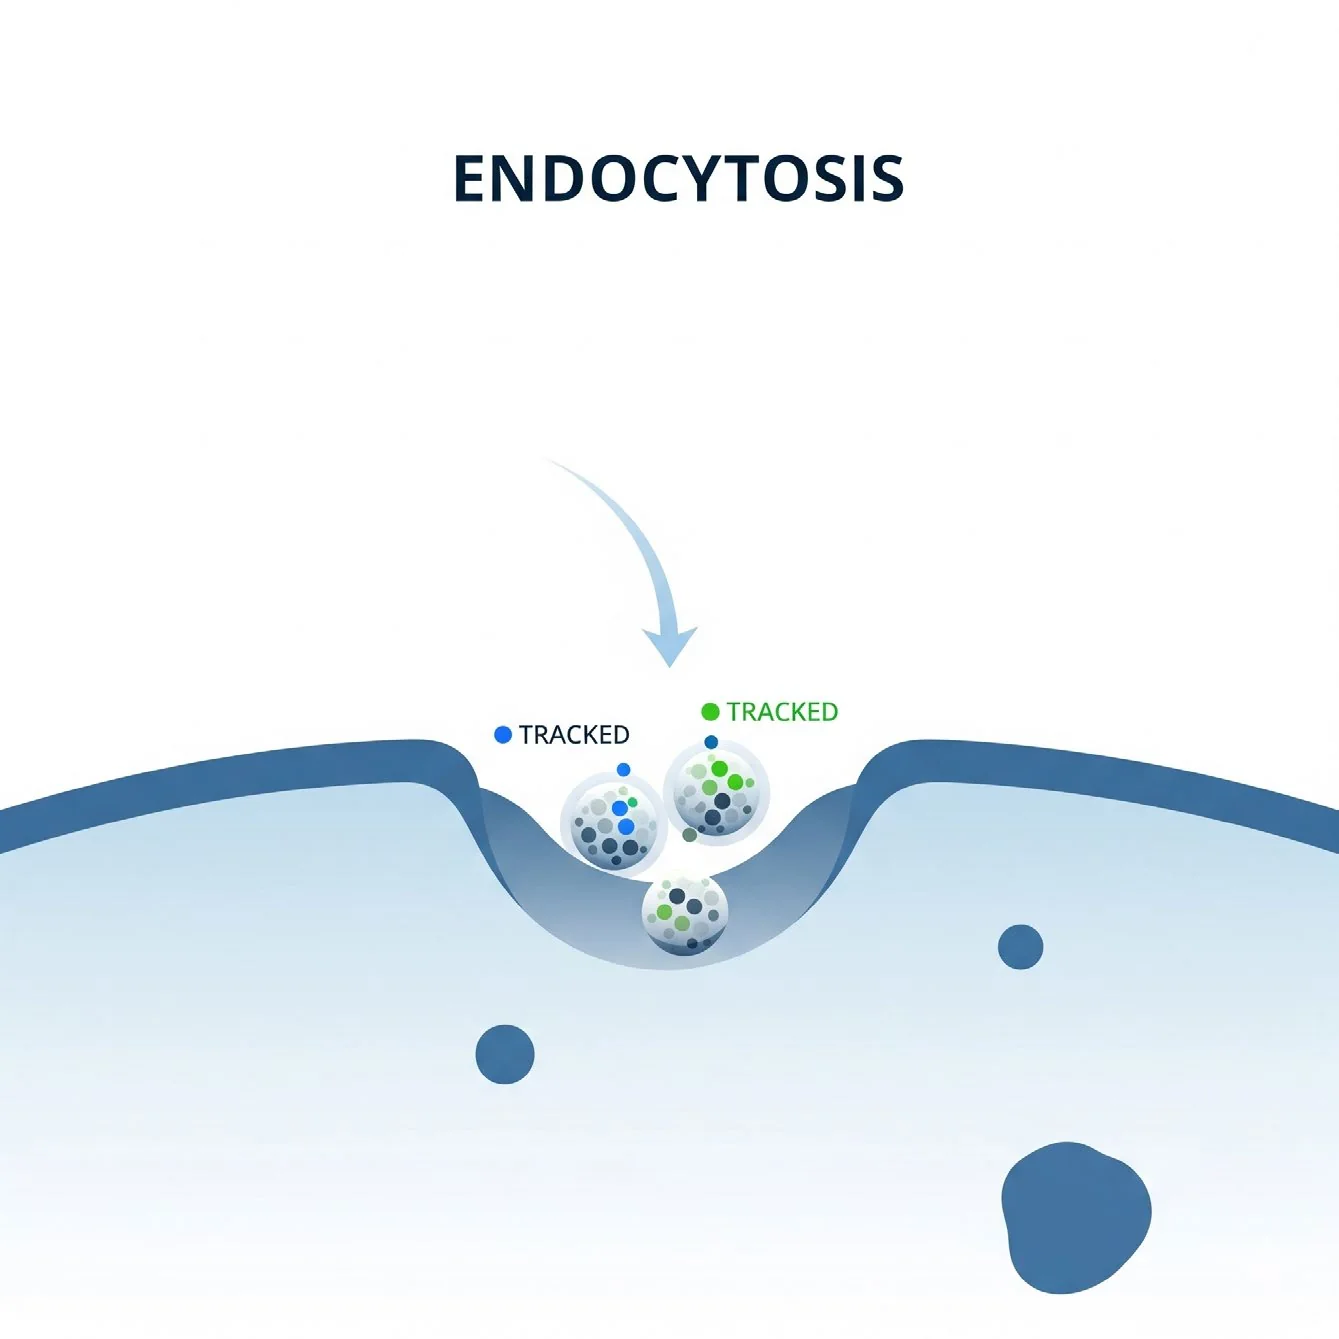
To visualise and study the cellular uptake (endocytosis) of nanocarriers by labelling them with a fluorescent dye and monitoring their internalisation over time using live or fixed-cell imaging.
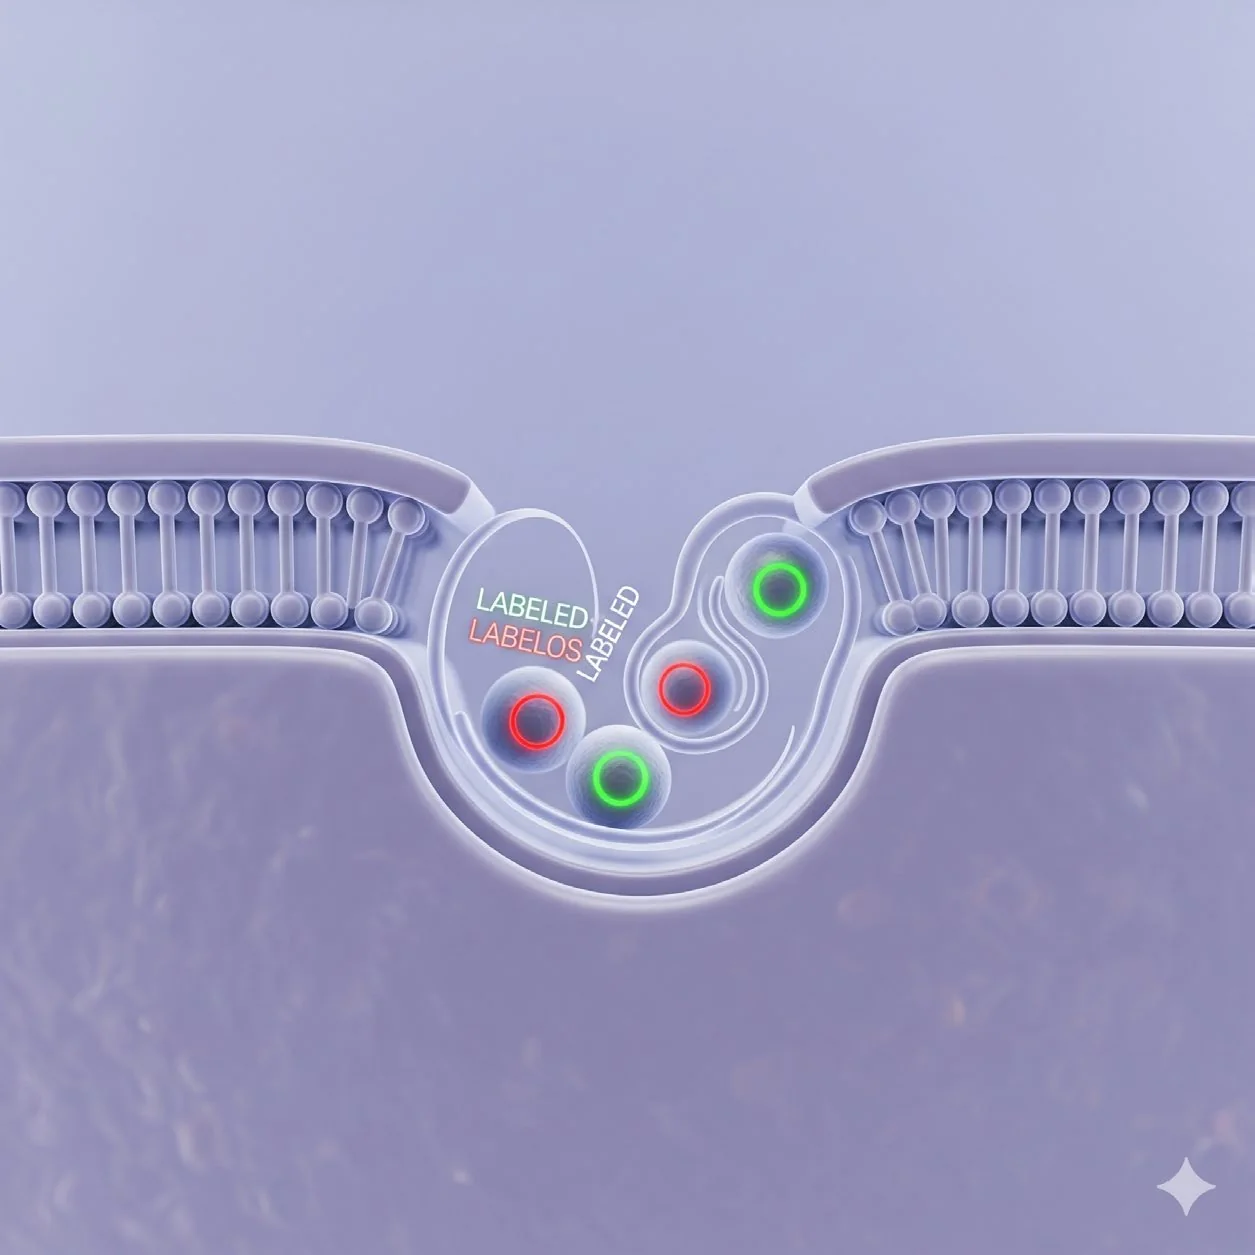
Nanocarriers (e.g., liposomes, polymeric nanoparticles, lipid nanoparticles) are conjugated with a fluorescent label (e.g., FITC, Cy5, Alexa Fluor dyes). These labelled nanocarriers are incubated with cells, and their uptake via endocytic pathways (clathrin-mediated, caveolae-mediated, macropinocytosis, etc.) is tracked using time-lapse or endpoint fluorescence microscopy.
Standard protocol
- 1
Cell seeding: seed cells (e.g., HeLa, HEK293) in glass-bottom plates at ~50–70% confluency. Incubate overnight at 37 °C, 5% CO₂.
- 2
Labelling nanocarriers: conjugate with a fluorescent dye (e.g., FITC-NHS ester for amine coupling) during synthesis or post-preparation. Purify via dialysis or centrifugation.
- 3
Incubation: replace medium with serum-free medium (optional, reduces non-specific uptake). Add labelled nanocarriers (e.g., 10–100 μg/mL) and incubate at 37 °C for various time points (e.g., 15 min, 30 min, 1 h, 4 h).
- 4
Controls
- 4 °C control (inhibits energy-dependent endocytosis).
- Inhibitor-treated cells (e.g., chlorpromazine for clathrin, methyl-β-cyclodextrin for caveolae).
- 5
Washing: remove the nanocarrier solution and wash cells 3× with cold PBS to remove surface-bound particles.
- 6
Fixation (if not live imaging): fix with 4% paraformaldehyde for 15 min at RT; wash 3× with PBS.
- 7
Nuclear and membrane staining (optional)
- DAPI (nucleus, 1 μg/mL, 5 min).
- Phalloidin (F-actin, 100 nM, 30 min) or CellMask (plasma membrane).
- 8
Imaging: visualise using a confocal or fluorescence microscope with appropriate filter sets.
- 9
Analysis: use ImageJ or Imaris to quantify fluorescence per cell, co-localisation with endosomal markers (e.g., EEA1, Rab5) and internalisation kinetics.
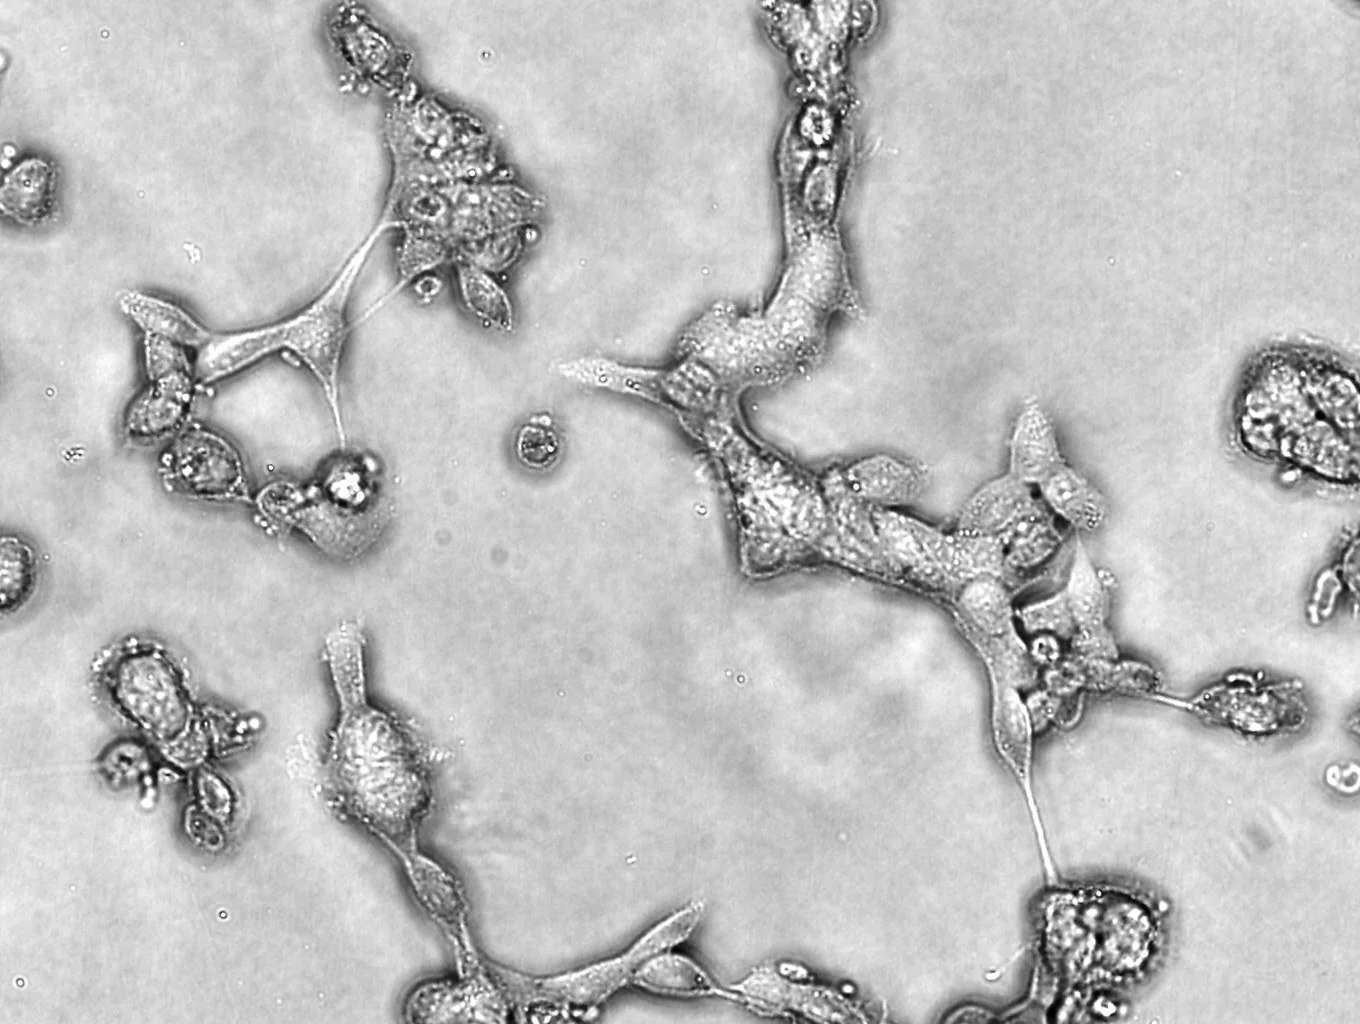
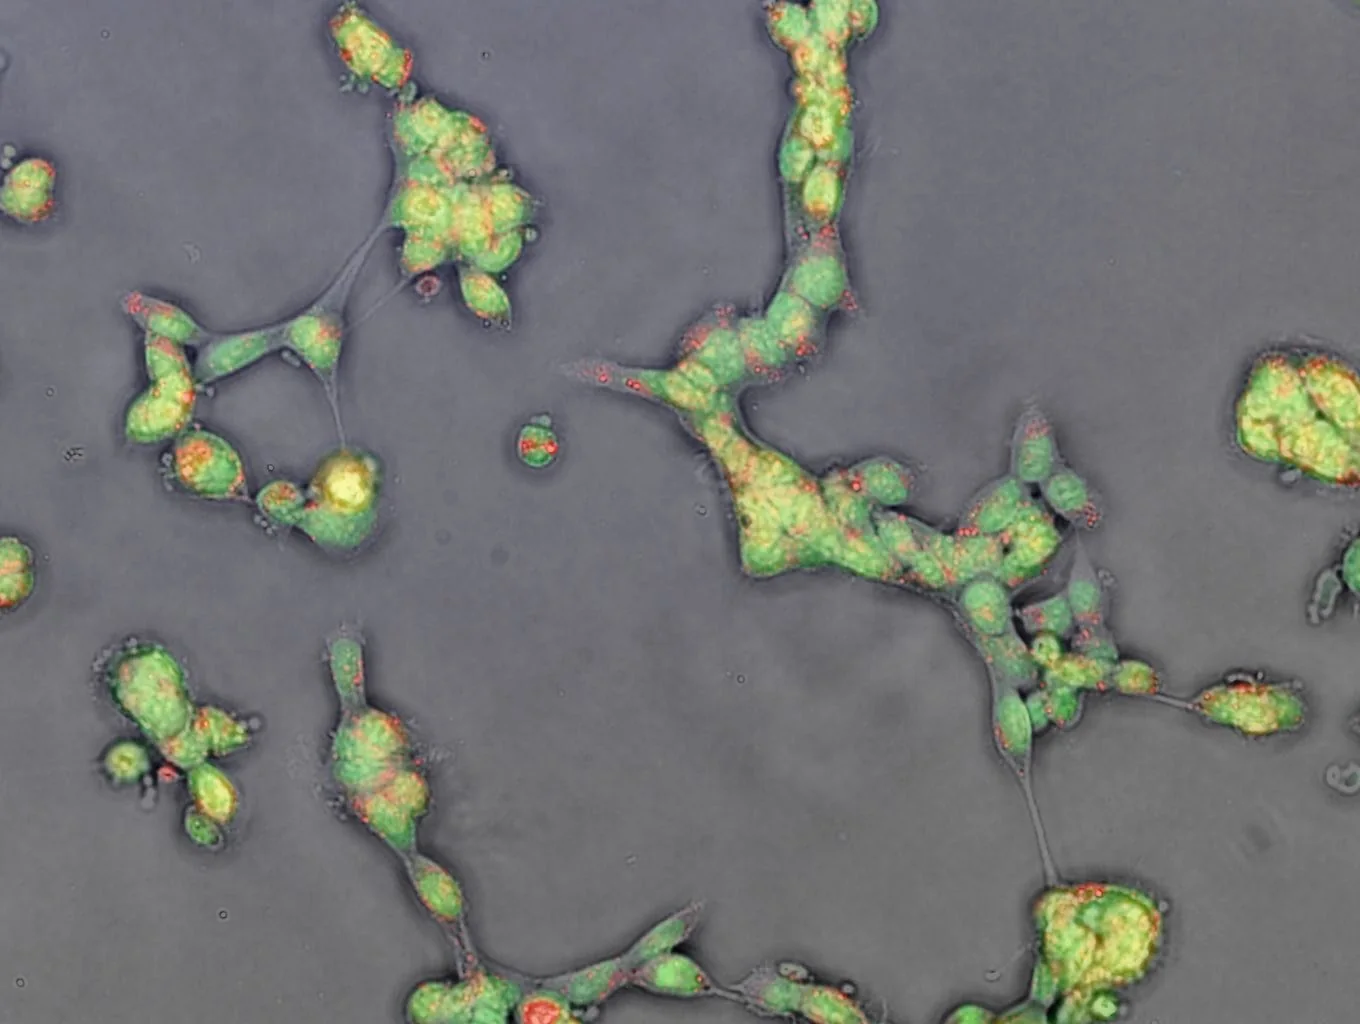
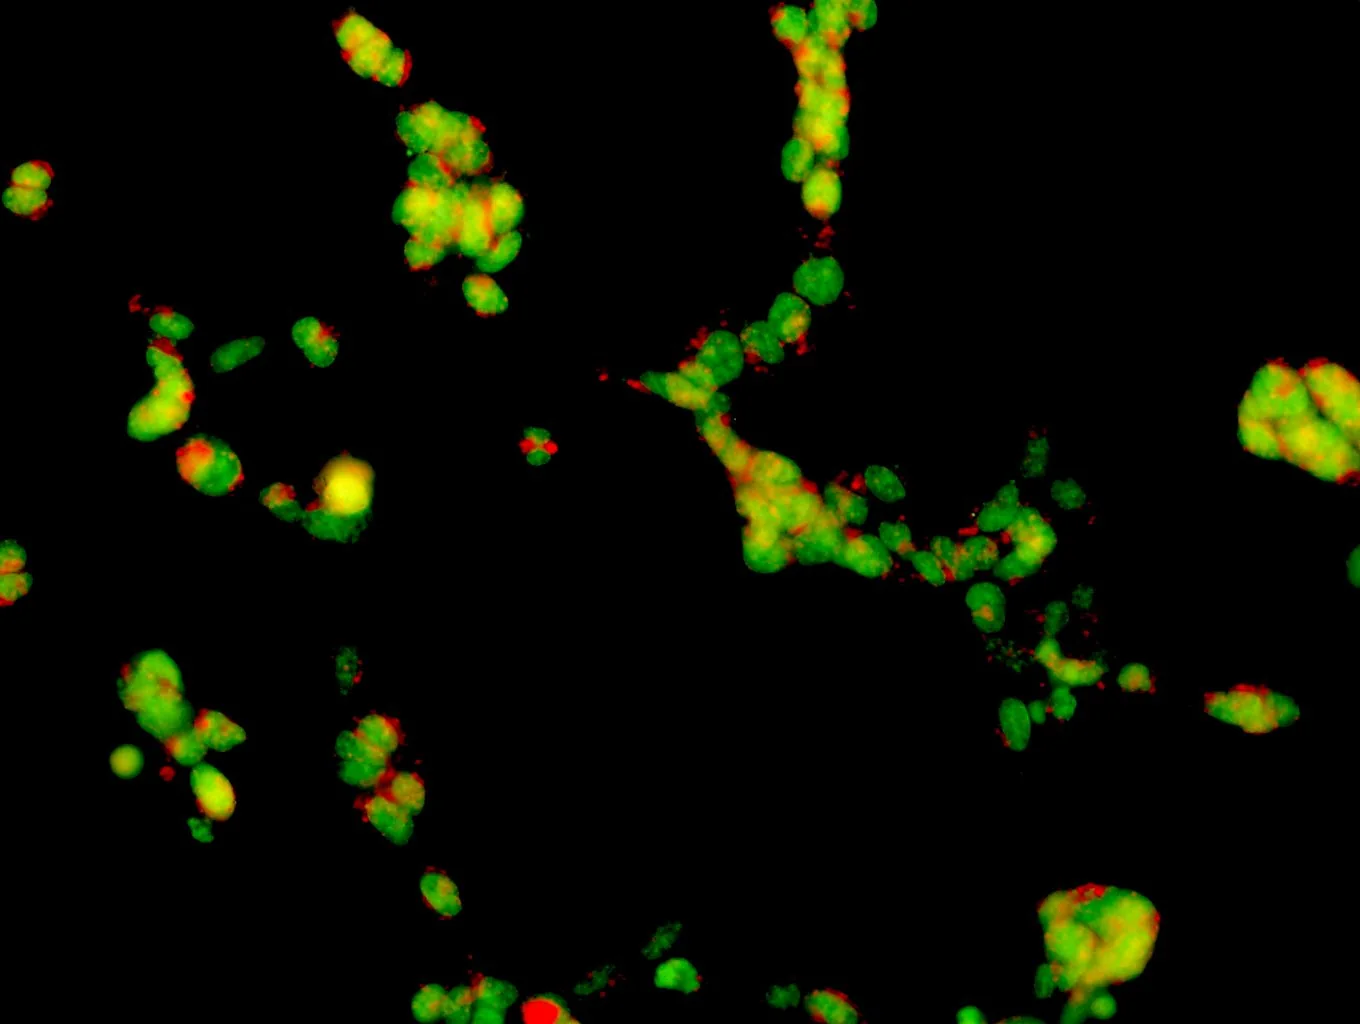
Representative data
Let's engineer the next delivery breakthrough together
We co-develop nanocarrier and biosensing programs with pharma, biotech and academic groups — from target selection through GMP supply.