

Skip to content
Brilliant Blue Biosciences logoBrilliant BlueBiosciences
Market opportunity

Genetic medicine is scaling fast — delivery decides who wins

A sourced, statistical look at the five markets we work in: transfection reagents, gene delivery, non-viral gene delivery, gene therapy and cell therapy. Every figure links to its published source.

4,487

gene, cell & RNA therapies in development worldwide[17]

159

approved gene, RNA and cell therapies globally (46 + 37 + 76)[17]

41%

of pipeline gene therapies now modify cells in vivo — delivery-dependent[17]

~12%

annual growth forecast for non-viral gene delivery to 2030–2035[6],[7]

Market snapshot

Five connected markets, growing between 6% and 22% a year

Headline estimate for each market from one named research firm: the current size and the published forecast. The markets overlap — non-viral delivery sits inside gene delivery, and both feed gene and cell therapy — so the values should not be added together.

Transfection reagents & equipment[1]

$1.26B (2025) → $1.81B (2031) · CAGR 6.2%

Non-viral gene delivery[6]

$3.98B (2025) → $7.11B (2030) · CAGR 12.3%

Gene delivery technologies (viral + non-viral)[3]

$6.19B (2025) → $22.79B (2034) · CAGR 15.6%

Gene therapy[10]

$7.88B (2025) → $18.42B (2030) · CAGR 18.5%

Cell therapy[13]

$7.43B (2025) → $55.52B (2035) · CAGR 22.3%

Current size Published forecastForecast years differ by report, as labelled.

Why delivery

The pipeline is huge. Getting cargo into the right cell is the bottleneck.

There are 4,487 gene, cell and RNA therapies in development[17]. Nearly all of them need a carrier to reach the cell. Viral vectors still dominate gene delivery revenue (69.4%)[4], yet 41% of pipeline gene therapies now work in vivo[17] — where targeting, safety and re-dosing matter most. That is the gap non-viral nanocarriers are built to close.

Gene therapies2,217 · 49%
RNA therapies1,370 · 30%
Cell therapies (non-GM)940 · 21%

Pipeline from preclinical to pre-registration, Q2 2026 (Citeline Pharmaprojects).[17]

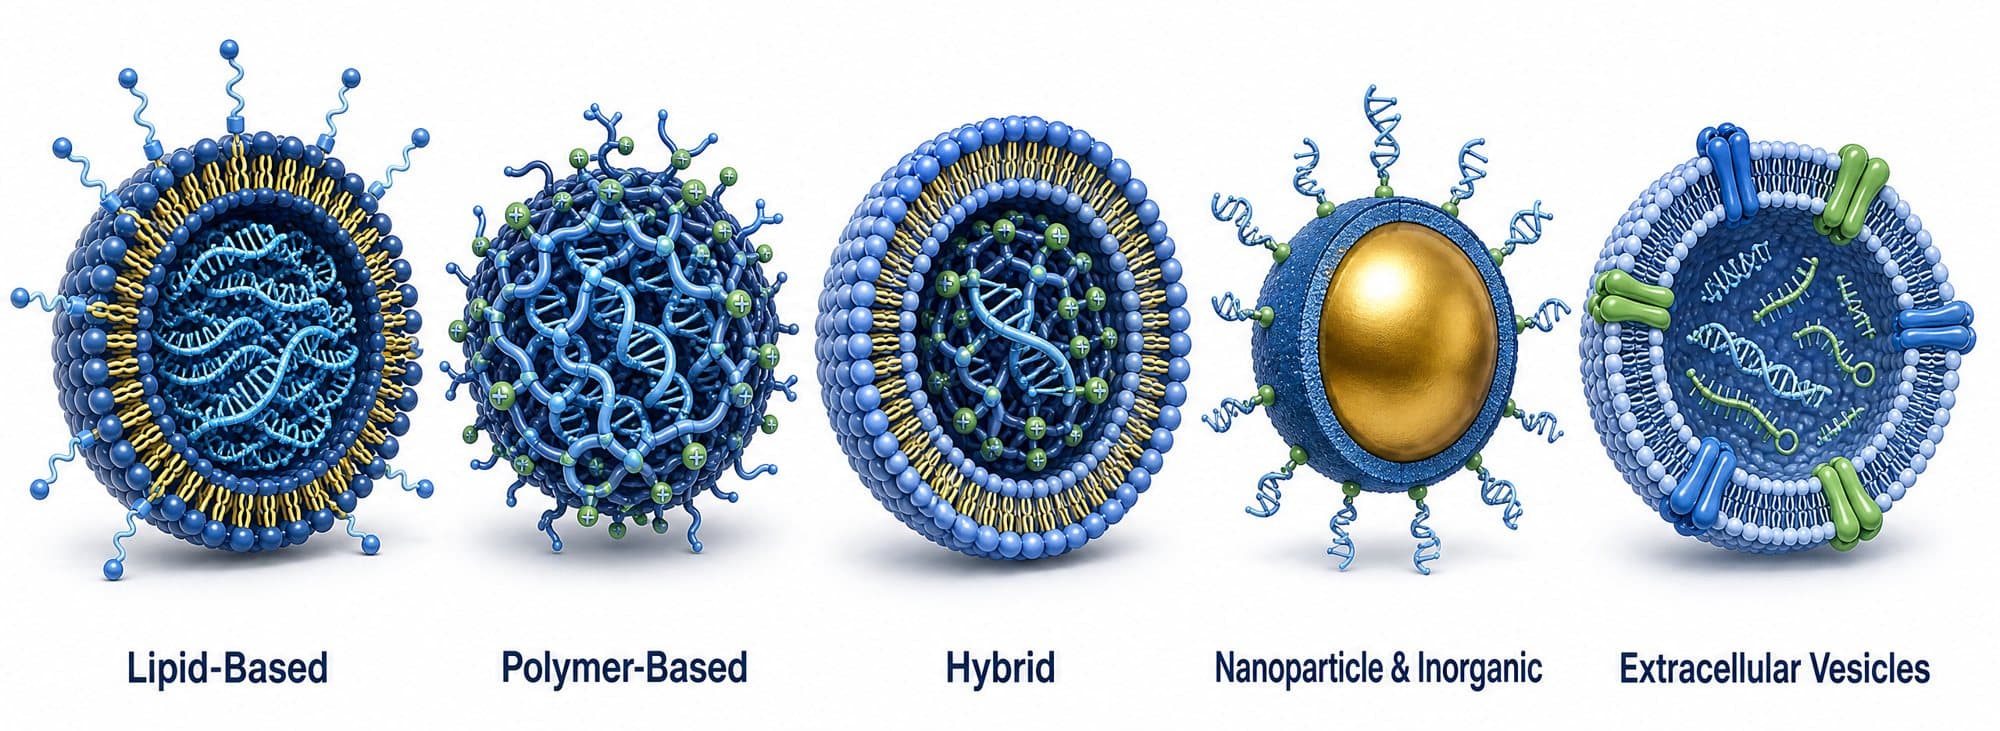
Nanoparticles delivering genetic cargo to cells
01 · Research tools

Transfection reagents & equipment

Transfection reagents — lipid, polymer and peptide carriers plus electroporation systems — are the everyday tools used to put DNA, mRNA, siRNA and CRISPR cargo into cells. It is a mature, steadily growing market whose fastest-growing slice is now cell and gene therapy manufacturing.

Published market estimates for Transfection reagents & equipment
Research firmMarket sizeForecastCAGR
Mordor Intelligence[1]$1.26B (2025)$1.81B (2031)6.24% (2026–31)
Grand View Research[2]—$3.1B (2033)8.9% (2026–33)
  • Reagents account for 73.6% of the market (≈ $927M in 2025); equipment is growing faster at a 12.6% CAGR.[1]
  • Cell and gene therapy manufacturing is the fastest-growing application, at a 15.0% CAGR; protein production is the largest (30.2%).[1]
  • Physical methods such as electroporation are the fastest-growing method (14.5% CAGR); electroporation alone held 22.2% of revenue in 2025.[1],[2]
  • North America holds 37.7% of demand; Asia-Pacific is the fastest-growing region (10.1% CAGR).[1]

What it means

A near-term revenue market: high-performance, low-toxicity reagents for hard-to-transfect primary and immune cells command premium prices as research shifts toward therapeutic cell engineering.

02 · Platform

Gene delivery technologies

Gene delivery covers every vehicle that carries genetic cargo to its target — viral vectors (AAV, lentivirus, adenovirus) and non-viral carriers (lipid nanoparticles, polymers, physical methods). Delivery is widely regarded as the key bottleneck of genetic medicine.

Published market estimates for Gene delivery technologies
Research firmMarket sizeForecastCAGR
Precedence Research[3]$6.19B (2025)$22.79B (2034)15.60% (2025–34)
Polaris Market Research[4]$6.72B (2026)$15.93B (2034)—
Precedence Research — viral vectors only[5]$4.27B (2025)$13.03B (2035)11.80%
  • Biological (viral-vector) systems held 69.4% of gene delivery revenue in 2025 — the incumbent, but costly and capacity-limited, technology.[4]
  • Among viral vectors, AAV holds 48%, lentivirus 20%, adenovirus 18% and retrovirus 8%; cell and gene therapy is 66% of use.[5]
  • North America generated more than 42% of gene delivery revenue in 2024.[3]
  • In vivo approaches are gaining share: 41% of pipeline gene therapies now modify cells inside the body rather than ex vivo.[17]

What it means

The overall delivery market is growing at roughly 15% a year. Every move from ex vivo to in vivo raises the value of a carrier that can reach the right cell safely and repeatedly.

03 · Our core field

Non-viral gene delivery

Non-viral carriers — lipid nanoparticles (LNPs), polymeric and hybrid nanoparticles, and physical methods — avoid viral immunogenicity and insertional risk, can be re-dosed, carry large or transient cargo such as mRNA and gene editors, and are cheaper and faster to manufacture.

Published market estimates for Non-viral gene delivery
Research firmMarket sizeForecastCAGR
Grand View Research[6]$3.70B (2024) · $3.98B (2025)$7.11B (2030)12.3% (2025–30)
Towards Healthcare[7]$4.18B (2025)$13.38B (2035)12.34% (2026–35)
Grand View Research — lipid nanoparticles only[8]$786.4M (2024)$1.54B (2030)13.64% (2025–30)
  • Chemical carriers (LNPs, polymers, lipoplexes) are the largest segment — $2.39B in 2024 — and are projected to grow fastest.[6]
  • Chemical methods make up about 60% of the market and physical methods 40%; research is the largest application (40%).[7]
  • mRNA is the leading LNP application, with 55.0% of LNP revenue in 2024.[8]
  • Q2 2026 saw 11 new mRNA-encoded CAR-T therapies enter the pipeline — as many as in all of 2025.[17]
  • LNP-delivered in vivo editors (PCSK9, LPA, ANGPTL3, TTR) are producing durable lipid reductions in phase 1 trials.[18],[26]

What it means

The highest-growth delivery segment and the one big pharma is buying into. Targeting beyond the liver and efficient endosomal escape remain the open technical problems — and the main source of value.

04 · Therapeutics

Gene therapy

Gene therapies add, silence or edit genes to treat disease at its source. Firms define the market differently (for example, whether CAR-T counts), so 2025 estimates vary widely — but every source expects high-teens or faster growth.

Published market estimates for Gene therapy
Research firmMarket sizeForecastCAGR
Grand View Research[9]$5.5B (2023)$18.2B (2030)18.9% (2024–30)
Research and Markets[10]$7.88B (2025)$18.42B (2030)18.52%
Fortune Business Insights[11]$3.57B (2025)$20.68B (2034)21.97%
Global Market Insights[12]$3.3B (2025)$33.6B (2035)26.2%
  • 46 gene therapies (including genetically modified cell therapies) are approved worldwide; 2,217 are in development — 49% of the whole advanced-therapy pipeline.[17]
  • The clinical pipeline is deep: 427 programmes in phase I, 387 in phase II and 59 in phase III (Q2 2026).[17]
  • Rare diseases and oncology lead development; Zolgensma earned $1.2B and Elevidys $899M in 2025.[17],[18]
  • The FDA's list of approved products keeps growing — 2026 approvals include Kresladi (LAD-I), Otarmeni (hearing loss) and a Sanfilippo type A therapy.[21],[17]

What it means

Most approved gene therapies still depend on viral vectors, so cost, re-dosing and immunity limit access. Non-viral carriers that match viral efficiency would open far larger patient populations.

05 · Therapeutics

Cell therapy

Cell therapies — CAR-T, TCR-T, NK, stem-cell and regenerative products — are the fastest-growing advanced-therapy market. Engineering these cells requires gene delivery, today mostly by lentivirus or electroporation.

Published market estimates for Cell therapy
Research firmMarket sizeForecastCAGR
Precedence Research[13]$7.43B (2025)$55.52B (2035)22.28% (2026–35)
Straits Research[15]$6.88B (2025)$38.24B (2034)21.05%
Mordor Intelligence[14]$5.58B (2025)$12.27B (2030)17.05%
MarketsandMarkets — cell therapy technologies (tools)[16]$4.41B (2025)$7.91B (2030)12.4%
  • Carvykti ($1.9B, +96%) and Breyanzi ($1.3B, +82%) became blockbusters in 2025, bringing the sector to four blockbuster products.[18]
  • CAR-T makes up 66% of the genetically modified cell therapy pipeline; 81% target cancer, while lupus, scleroderma and myasthenia gravis lead outside oncology.[17]
  • 76 non-genetically modified cell therapies are approved and 940 are in development.[17]
  • North America holds about 59% of the cell therapy market.[13]

What it means

In vivo CAR-T — engineering T cells inside the patient with targeted nanoparticles — could remove the cost and weeks of ex vivo manufacturing. It is the hottest deal area in the sector.

Capital & deals

Investment has recovered — and big pharma is buying in vivo delivery

Cell and gene therapy financing fell after the 2021 peak, rebounded in 2024 and stabilised in 2025. Dealmaking in Q2 2026 reached 118 transactions, the highest quarterly total in a year, and 20 start-ups raised $500.4M in seed and Series A rounds.

Cell & gene therapy investment, $B[18],[19],[20]

19.9
2020
22.7
2021
12.6
2022
11.7
2023
15.2
2024
11.1
2025*

Alliance for Regenerative Medicine data. *2025 is our sum of ARM's published Q1–Q3 ($7.9B) and Q4 ($3.2B) figures; ARM notes quarterly data may be revised. Q2 2026 deal and start-up figures: ASGCT/Citeline.[17]

Landmark in vivo delivery deals

  • Eli Lilly → Kelonia[22]up to $7.0B

    In vivo CAR-T (lentiviral gene placement); $3.25B upfront · Apr 2026

  • J&J → Sail Biomedicines[24]$785M + $2.58B option

    In vivo CAR-T for autoimmune disease · Jul 2026

  • Eli Lilly → Orna Therapeutics[23]up to $2.4B

    In vivo CAR-T using LNP-delivered circular RNA · Feb 2026

  • AbbVie → Capstan Therapeutics[25]$2.1B

    Targeted-LNP in vivo CAR-T; largest CGT acquisition since 2020 · 2025

  • BMS → Orbital Therapeutics[18]$1.5B

    RNA / in vivo cell therapy platform · Q4 2025

2,130

active cell & gene therapy clinical trials (Q4 2025)[18]

1,856

therapy developers worldwide (Q4 2025)[18]

4

CGT blockbusters (>$1B sales): Zolgensma, Yescarta, Carvykti, Breyanzi[18]

Where we fit

One delivery platform, three ways to capture value

Our nanocarrier work sits where these markets overlap: the tools researchers buy today, and the delivery problem therapy developers must solve next.

01

Research reagents

Low-toxicity transfection carriers for primary, stem and immune cells — the fastest-growing use in a $1.3B market growing 6–9% a year.

02

Cell therapy engineering

Non-viral alternatives to lentivirus and electroporation for ex vivo and in vivo CAR-T, NK and stem-cell engineering — the area drawing multi-billion-dollar deals.

03

Therapeutic delivery partnerships

Targeted, charge-shifting nanocarriers for mRNA, siRNA and gene editors beyond the liver, licensed or co-developed with gene therapy developers.

Sources & methodology

Market sizes come from published summaries of commercial research reports. Firms define markets differently (for example, reagents only versus reagents and equipment, or whether CAR-T is counted as gene therapy), so we show several estimates side by side rather than averaging them. Pipeline, approval, revenue and investment figures come from ASGCT/Citeline, the Alliance for Regenerative Medicine, the FDA and company announcements. All values are in US dollars. Figures were compiled in October 2026.

  1. [1] Mordor Intelligence. Transfection Reagents and Equipment Market — Size, Share & Growth Drivers 2031
  2. [2] Grand View Research. Transfection Reagents and Equipment Market to Reach $3.1 Billion by 2033 (press release)
  3. [3] Precedence Research via BioSpace. Gene Delivery Technologies Market Size to Exceed USD 22.79 Billion by 2034 (Feb 2025)
  4. [4] Polaris Market Research. Gene Delivery Technologies Market Size, Share Report, 2026–2034
  5. [5] Precedence Research. Viral Vector Market Databook
  6. [6] Grand View Research. Non-viral Gene Delivery Technologies Market (2025–2030)
  7. [7] Towards Healthcare. Non-viral Gene Delivery Technologies Market Sizing 2026–2035
  8. [8] Grand View Research. Lipid Nanoparticle Market Size to Reach $1.54Bn by 2030 (press release)
  9. [9] Grand View Research. Gene Therapy Market Size and Share Report, 2024–2030
  10. [10] Research and Markets. Gene Therapy Market — Forecasts from 2025 to 2030
  11. [11] Fortune Business Insights. Gene Therapy Market Size, Share
  12. [12] Global Market Insights. Gene Therapy Market Size & Share, 2026–2035
  13. [13] Precedence Research. Cell Therapy Market Size to Hit USD 55.52 Billion by 2035
  14. [14] Mordor Intelligence. Cell Therapy Market Size, Growth Segments — Share 2031
  15. [15] Straits Research. Cell Therapy Market Size, Share, Growth, Analysis, 2034
  16. [16] MarketsandMarkets. Cell Therapy Technologies Market Report 2025–2030
  17. [17] ASGCT & Citeline. Gene, Cell & RNA Therapy Landscape Report, Q2 2026 (July 2026)
  18. [18] Alliance for Regenerative Medicine. Q4 2025 Cell and Gene Therapy Sector Snapshot (Feb 2026)
  19. [19] Alliance for Regenerative Medicine. Q3 2025 Cell and Gene Therapy Sector Snapshot (Nov 2025)
  20. [20] BioSpace. Cell and Gene Therapy Investment Ticks Up After Hard Few Years
  21. [21] U.S. FDA. Approved Cellular and Gene Therapy Products
  22. [22] Eli Lilly and Company. Lilly to acquire Kelonia Therapeutics to advance in vivo CAR-T cell therapies
  23. [23] BioPharma Dive. Lilly buys ‘in vivo’ CAR-T maker Orna, extending streak of genetic medicine deals
  24. [24] BioPharma Dive. J&J nabs option to buy ‘in vivo’ CAR-T maker Sail for nearly $2.6B
  25. [25] Citeline Scrip. In Vivo CAR-T Interest Grows With AbbVie Acquisition
  26. [26] Innovative Genomics Institute. CRISPR Clinical Trials: A 2026 Update